 quoneon
Source images retain the licenses and credits listed below. Display copies have been resized or converted to WebP as noted. Reference images are distinct from Pop Lab outputs.
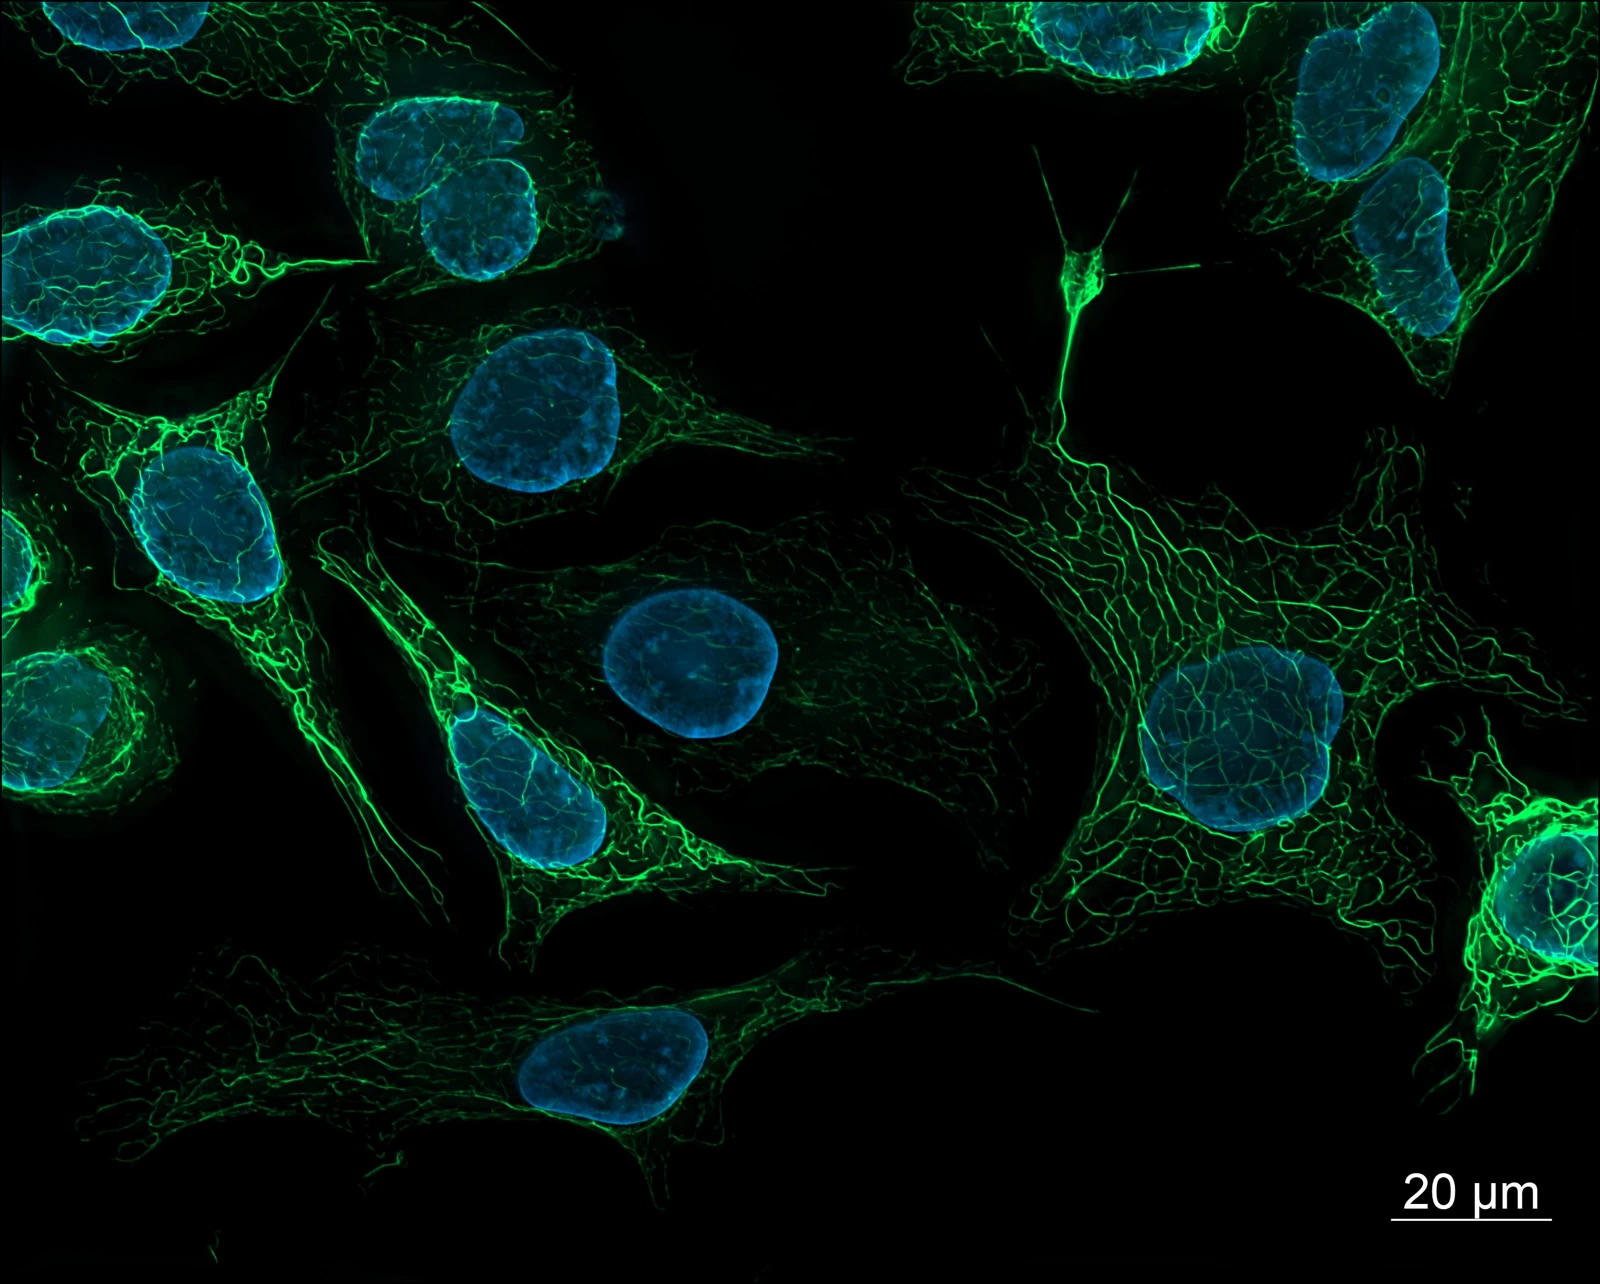
Fluorescence microscopy of human-derived cells
SK8/18-2 human-derived cells: vimentin labeled green and DAPI-labeled nuclei in blue.
Creator: ZEISS Microscopy from Germany
License: CC BY 2.0
Display changes: Resized to fit 1600 × 1400 pixels and converted to WebP; scientific content unchanged.

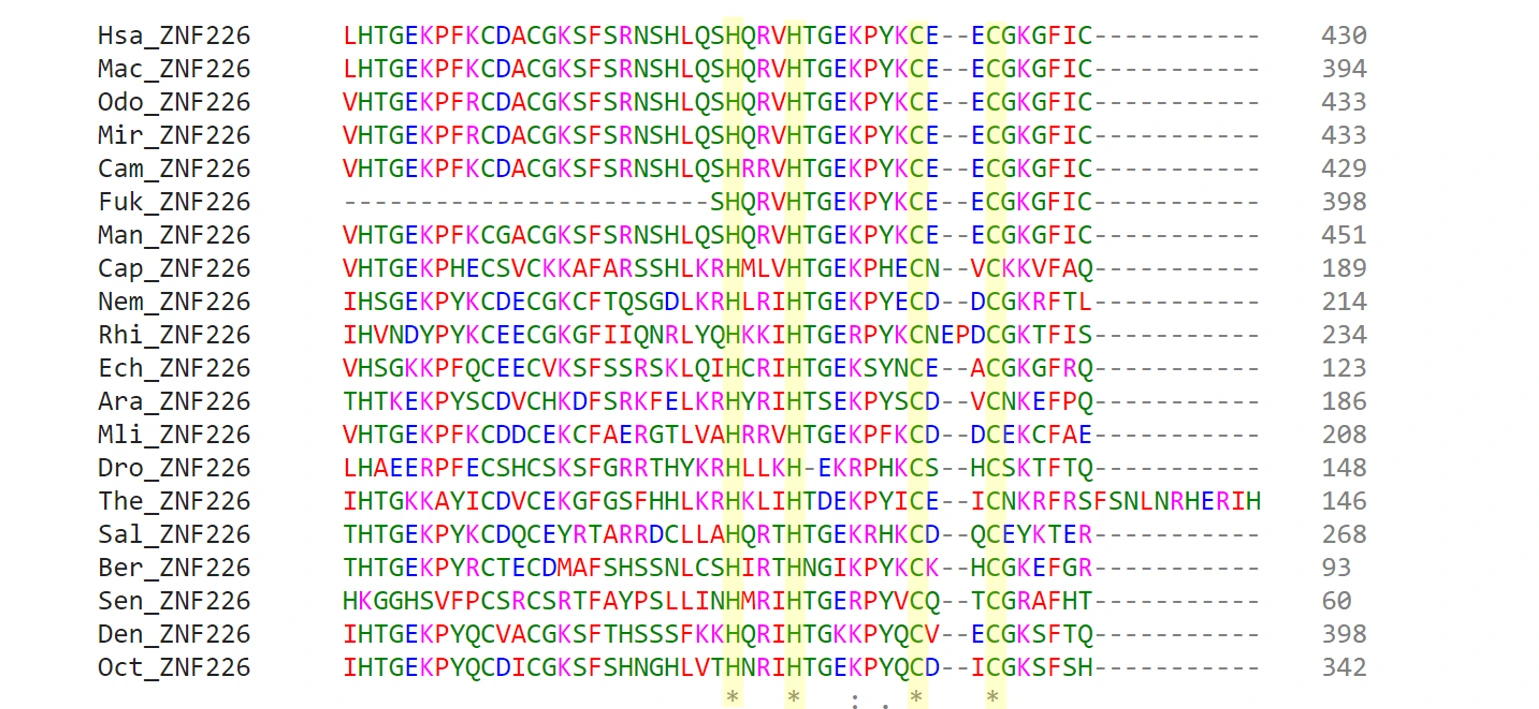
Multiple alignment of ZNF226 protein sequences
Published alignment of ZNF226 homologs, highlighting conserved sequence regions.
Creator: St9913
License: CC BY-SA 4.0
Display changes: Resized to fit 1600 × 1400 pixels and converted to WebP; scientific content unchanged.

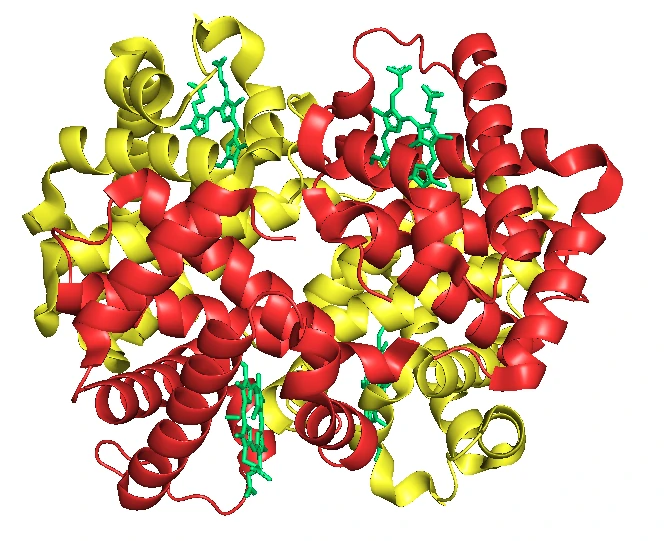
Fetal hemoglobin: protein structure
A representation based on PDB 4MQJ: α subunits in red, γ subunits in yellow, and heme groups in green.
Creator: Sciencingabout
License: CC BY-SA 4.0
Display changes: Resized to fit 1600 × 1400 pixels and converted to WebP; scientific content unchanged.

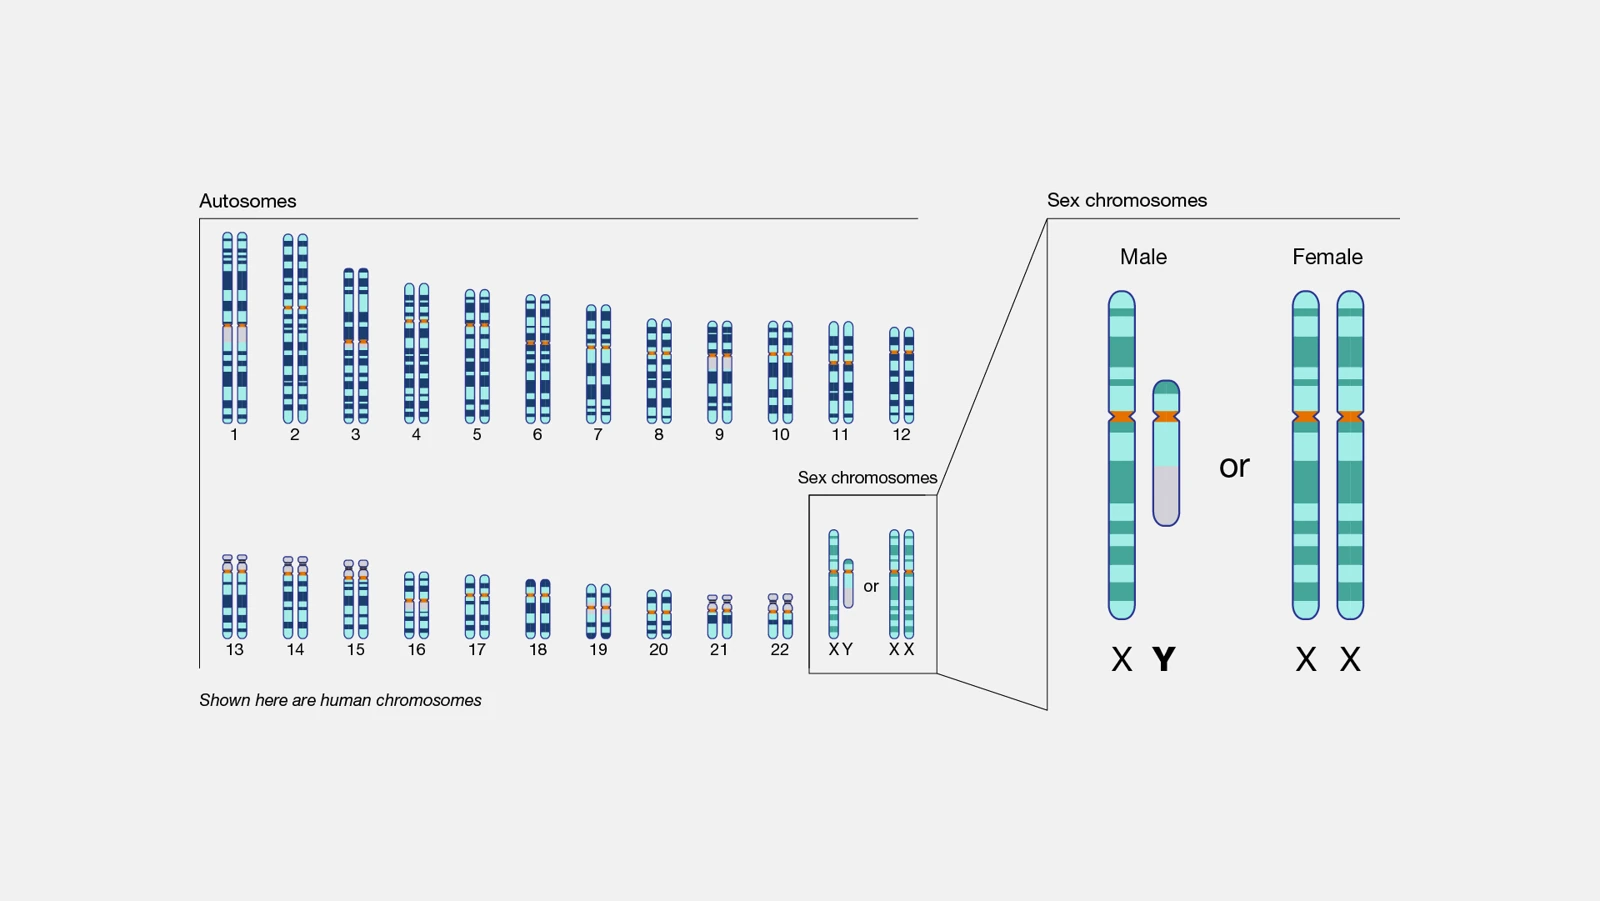
Human chromosome organization
An NHGRI diagram showing autosomes and sex chromosomes in a human karyotype.
Creator: National Human Genome Research Institute (NHGRI)
License: Public domain
Display changes: Resized to fit 1600 × 1400 pixels and converted to WebP; scientific content unchanged.

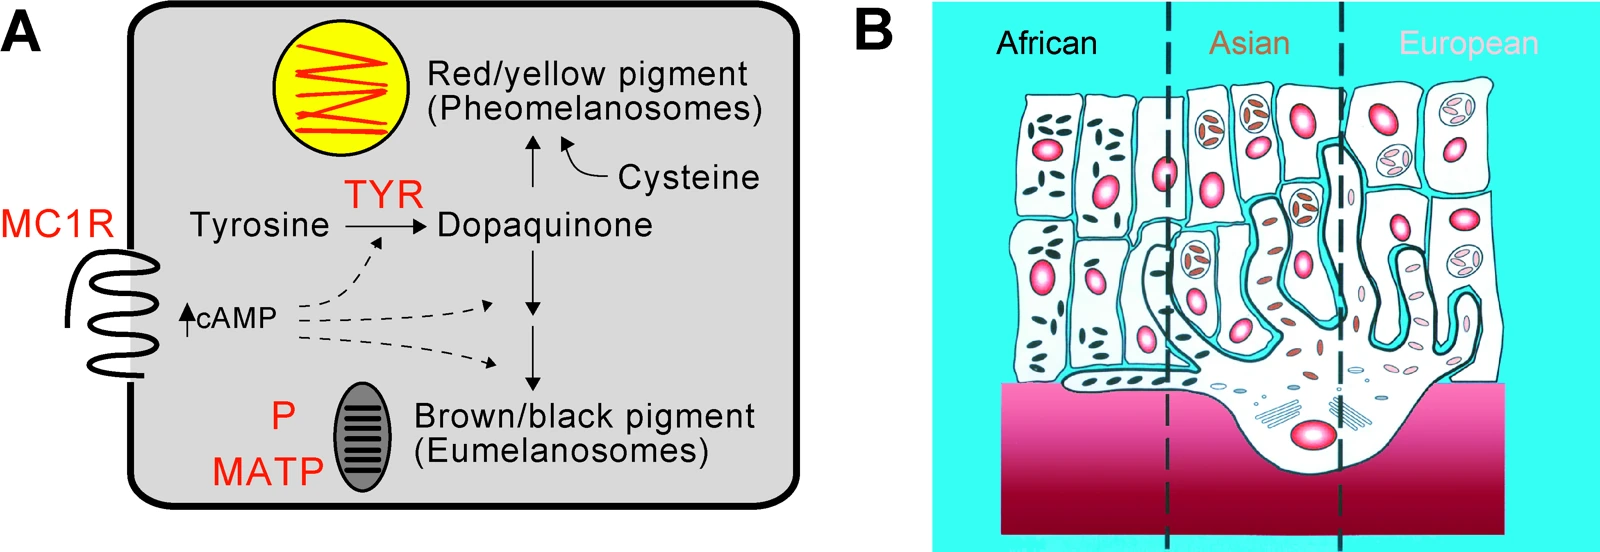
Skin pigmentation: biochemistry and histology
A published scientific diagram relating pigmentation pathways to melanosome organization.
Creator: Gregory S Barsh
License: CC BY 2.5
Display changes: Resized to fit 1600 × 1400 pixels and converted to WebP; scientific content unchanged.

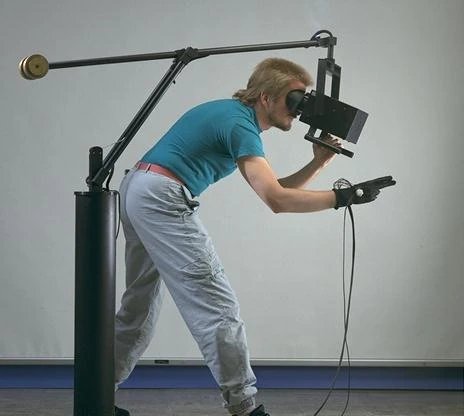
Virtual-reality hardware at NASA Ames
A historical NASA Ames virtual-reality headset and glove system; a hardware reference.
Creator: National Aeronautics and Space Administration.
License: Public domain
Display changes: Resized to fit 1600 × 1400 pixels and converted to WebP; scientific content unchanged.

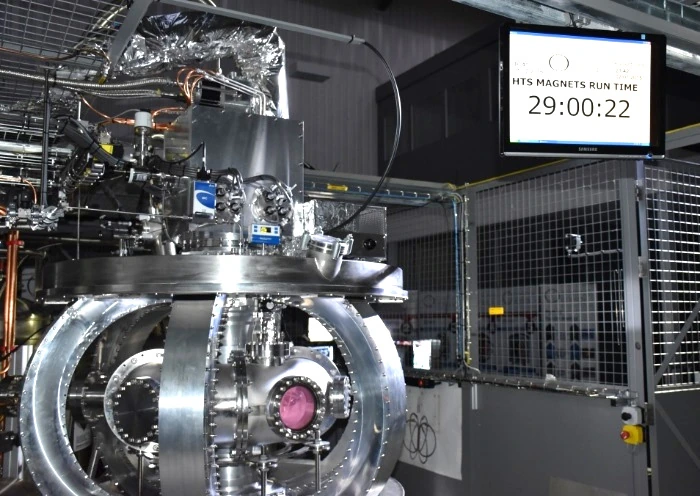
ST25-HTS tokamak during an RF discharge
The ST25-HTS tokamak during an extended radio-frequency discharge demonstration.
Creator: A. Sykes et al.
License: CC BY 3.0
Display changes: Resized to fit 1600 × 1400 pixels and converted to WebP; scientific content unchanged.

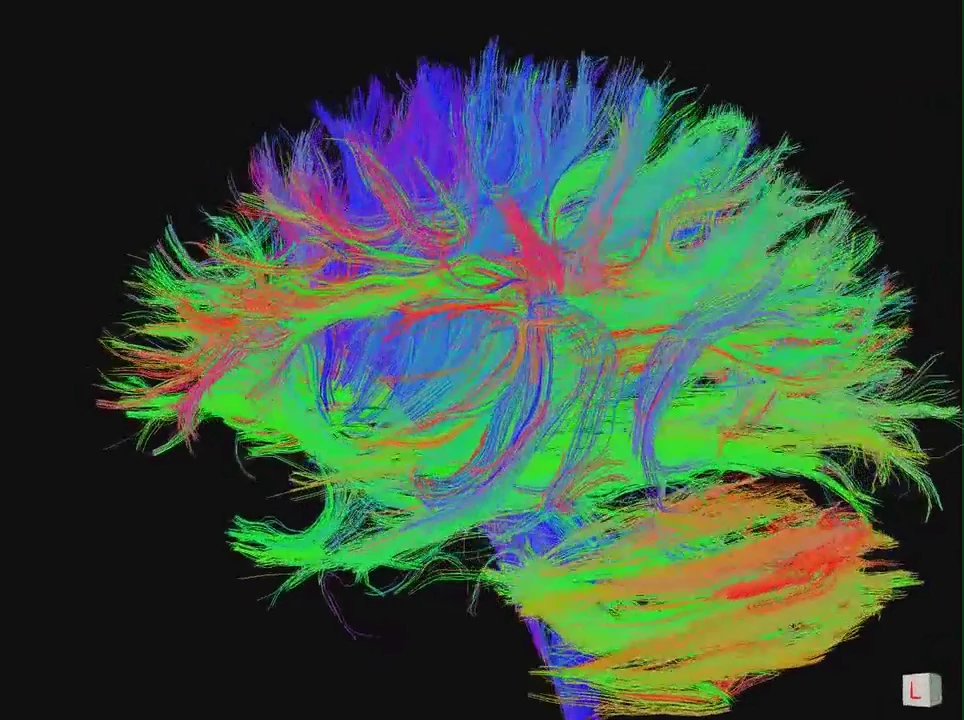
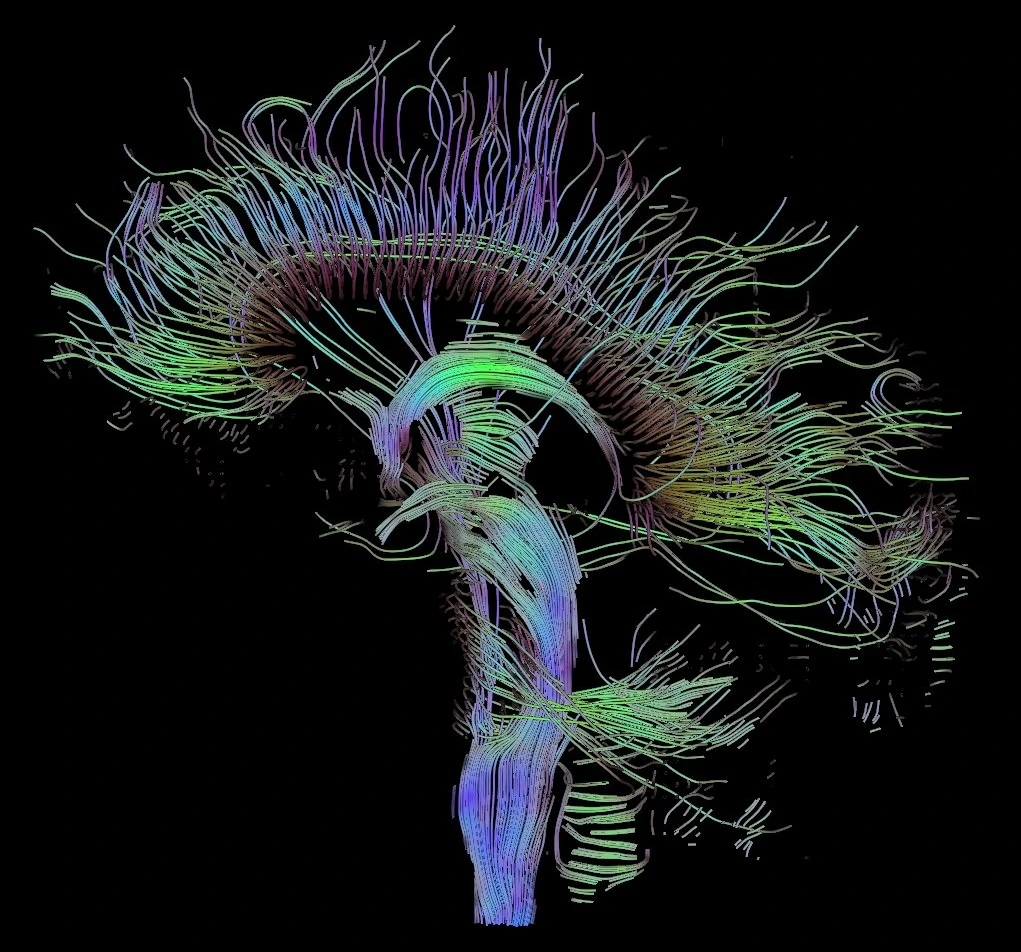
Whole-brain diffusion MRI tractography
Streamlines reconstructed from measured diffusion MRI using deterministic tractography.
Creator: jgmarcelino from Newcastle upon Tyne, UK
License: CC BY 2.0
Display changes: Resized to fit 1600 × 1400 pixels and converted to WebP; scientific content unchanged.

DTI fiber tracts through the midsagittal plane
Reconstructed tracts passing through the midsagittal plane, including callosal pathways.
Creator: Thomas Schultz
License: CC BY-SA 3.0
Display changes: Resized to fit 1600 × 1400 pixels and converted to WebP; scientific content unchanged.

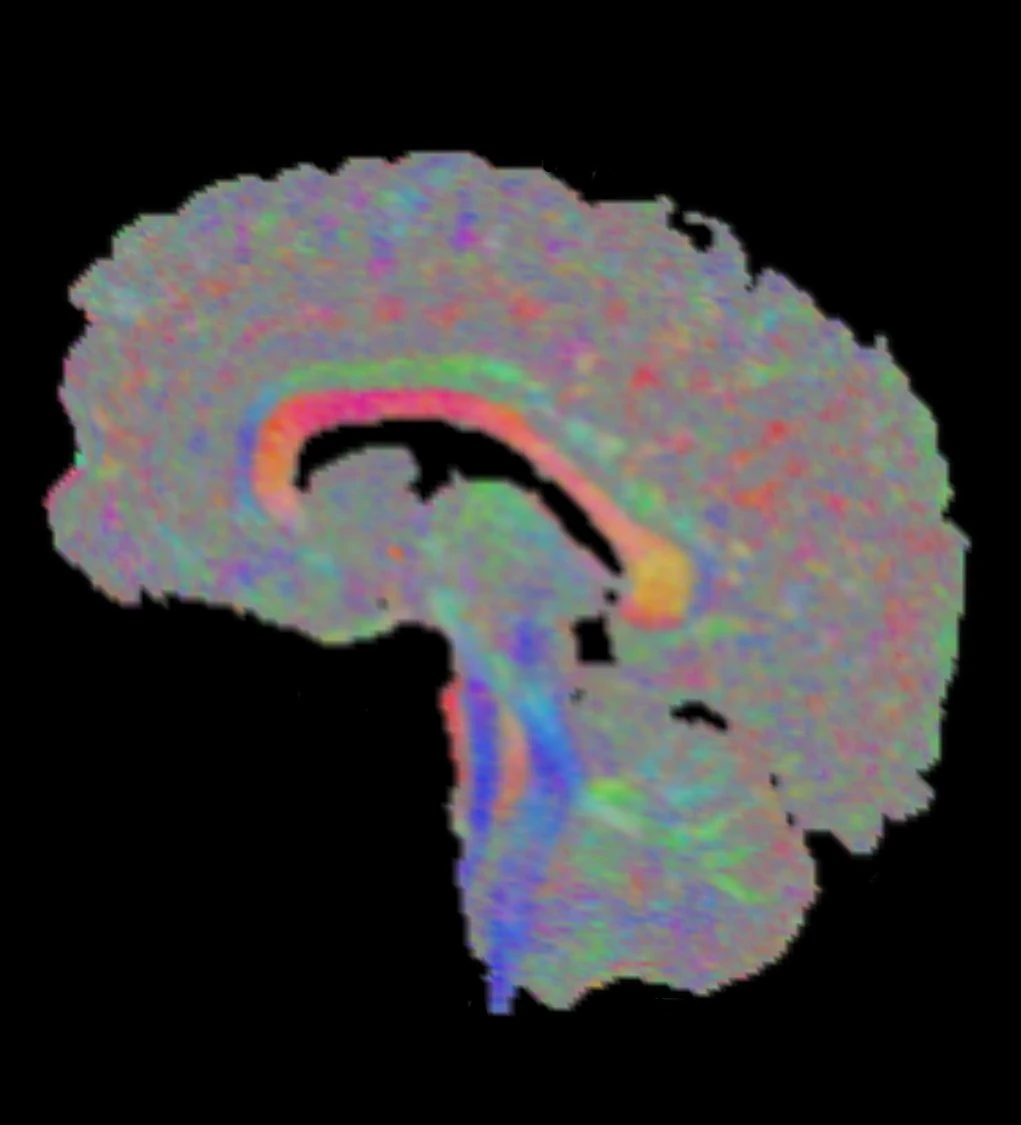
Direction-encoded diffusion tensor map
A sagittal DTI slice using XYZ-to-RGB principal-direction coloring.
Creator: Thomas Schultz
License: CC BY-SA 3.0
Display changes: Resized to fit 1600 × 1400 pixels and converted to WebP; scientific content unchanged.

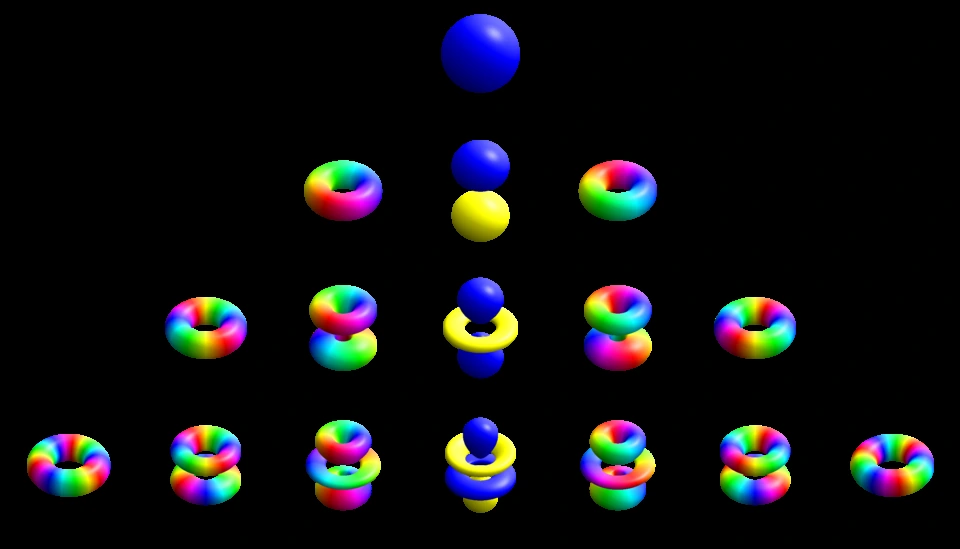
Hydrogenic atomic orbital representations
Single-electron orbital representations indexed by quantum numbers; colors encode complex phase.
Creator: Geek3
License: CC BY-SA 4.0
Display changes: Wikimedia 960-pixel thumbnail converted to WebP; scientific content unchanged.

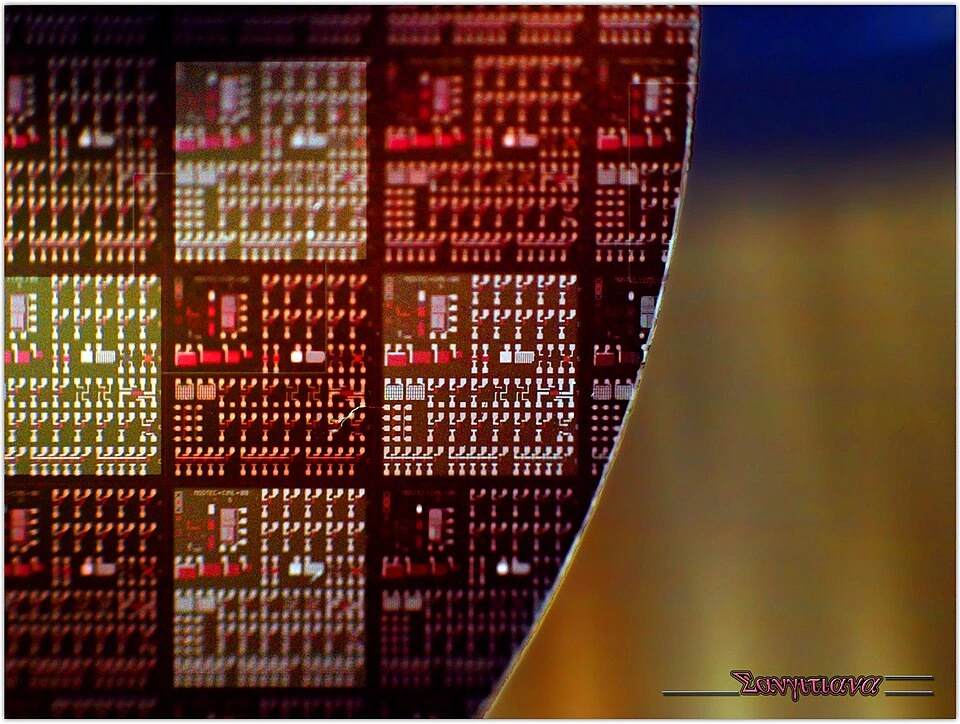
Semiconductor wafer and integrated-circuit patterns
A semiconductor wafer showing patterned die regions.
Creator: Sangitiana Fararano
License: CC BY-SA 2.0
Display changes: Wikimedia 960-pixel thumbnail converted to WebP; scientific content unchanged.

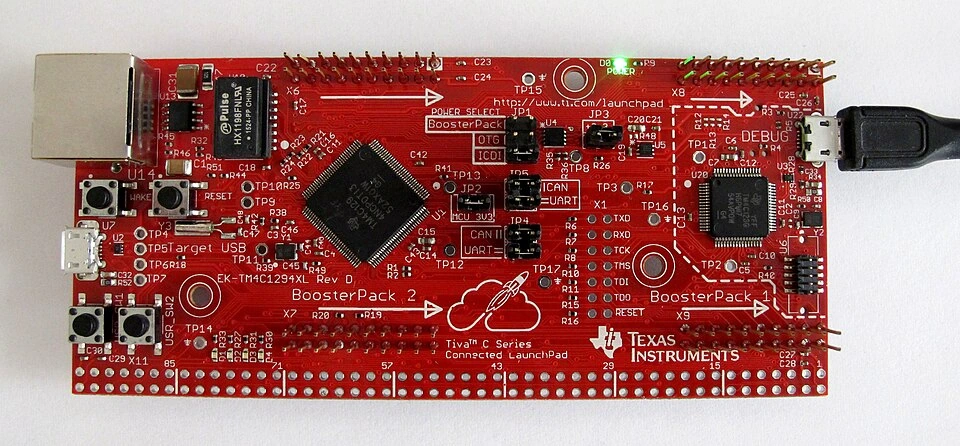
Embedded-system development board
A Texas Instruments Tiva-C LaunchPad board as an embedded-hardware reference.
Creator: wdwd
License: CC BY-SA 4.0
Display changes: Wikimedia 960-pixel thumbnail converted to WebP; scientific content unchanged.

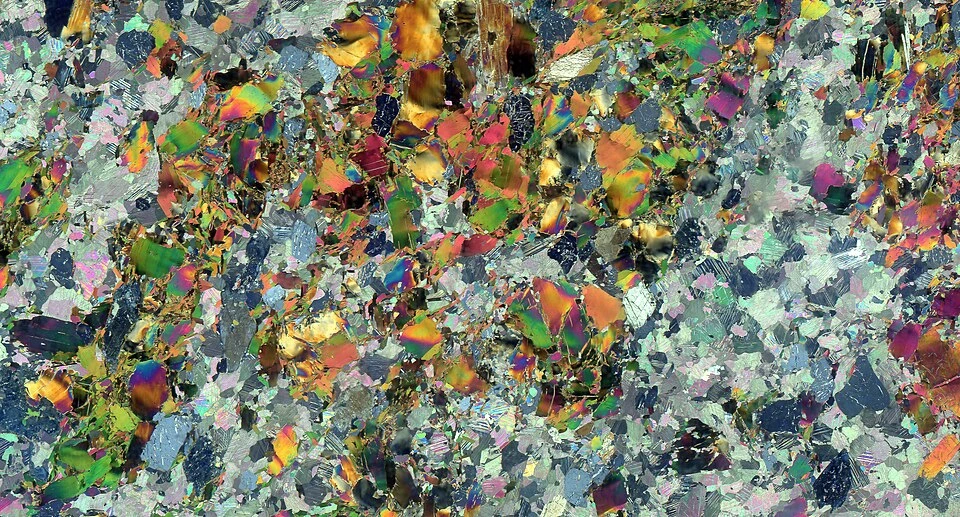
Minerals in a cross-polarized thin section
A thin section from the Siilinjärvi apatite deposit imaged in cross-polarized transmitted light.
Creator: kallerna
License: CC BY-SA 4.0
Display changes: Wikimedia 960-pixel thumbnail converted to WebP; scientific content unchanged.

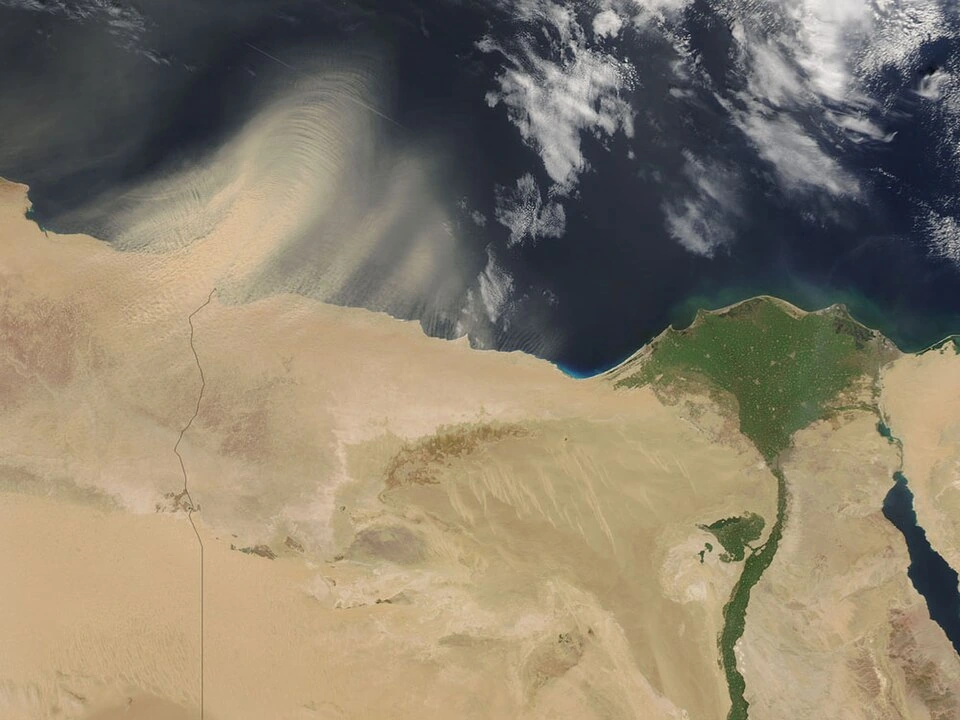
Satellite observation of the Nile Delta
NASA satellite imagery of the Nile Delta and its surrounding landscape.
Creator: National Aeronautics and Space Administration (NASA)
License: Public domain
Display changes: Wikimedia 960-pixel thumbnail converted to WebP; scientific content unchanged.

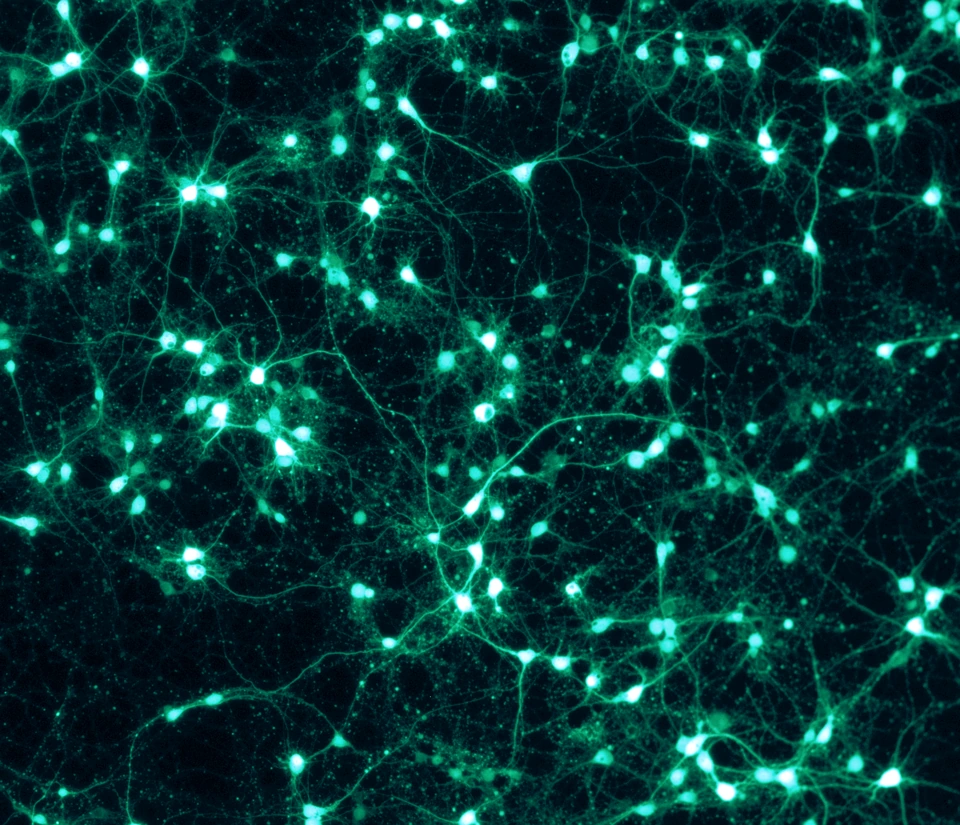
GFP-expressing cortical neurons
Rat cortical neurons grown in vitro and expressing green fluorescent protein.
Creator: ManuelSchottdorf
License: CC BY-SA 4.0
Display changes: Wikimedia 960-pixel thumbnail converted to WebP; scientific content unchanged.

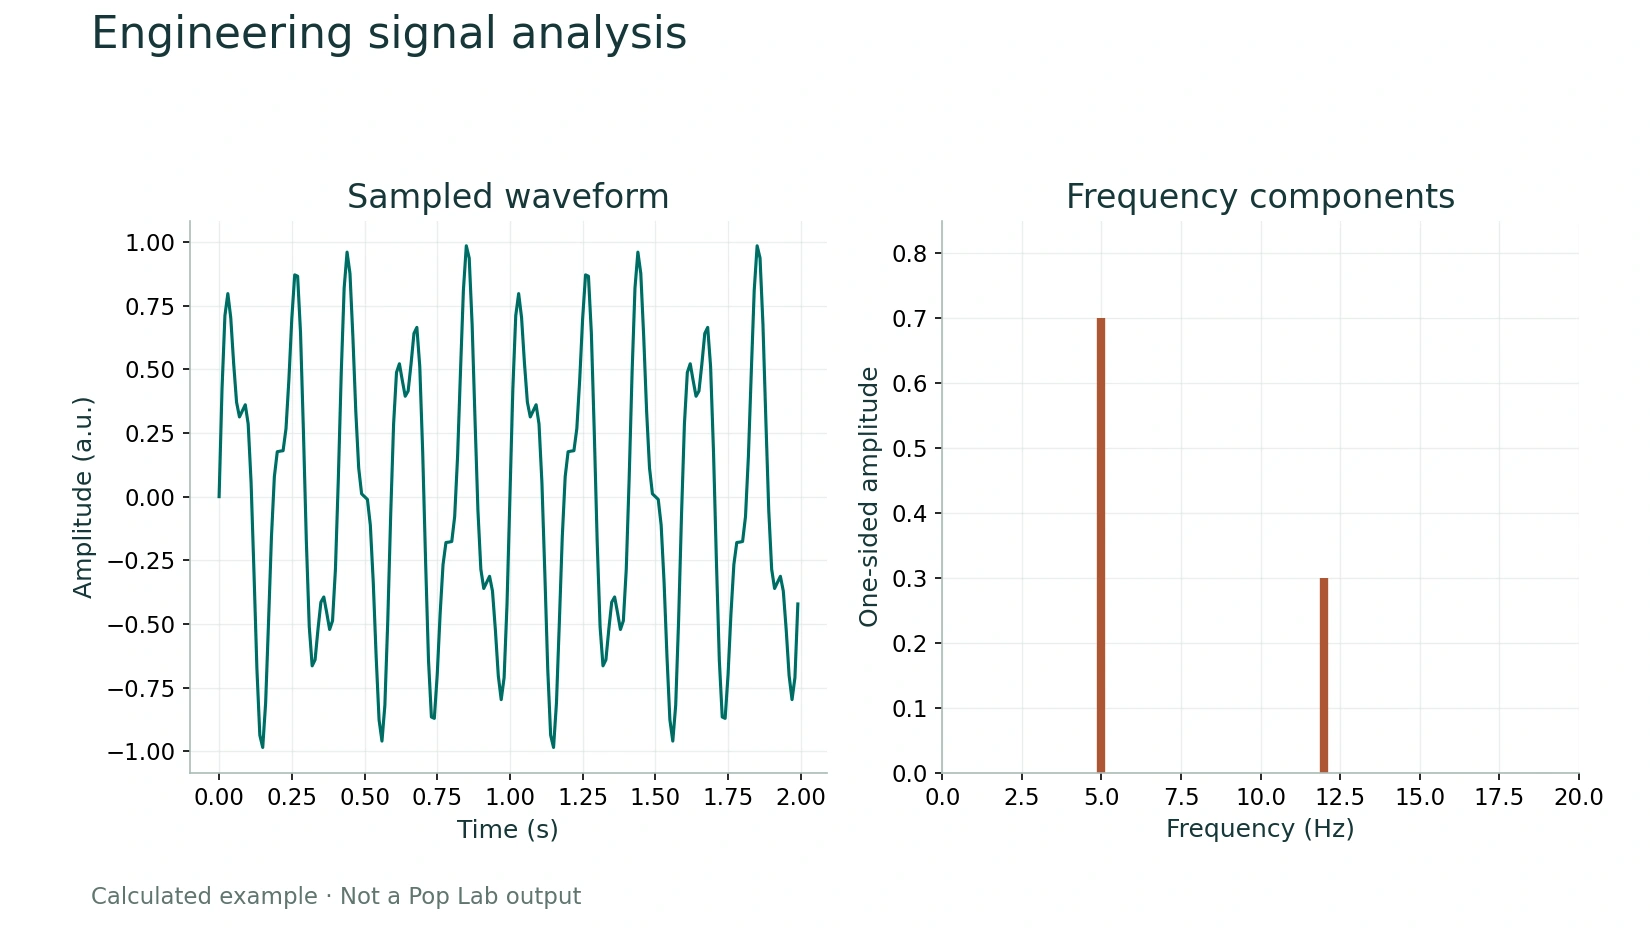
Industrial robotic arm and controller
A UR16e collaborative robot with its controller and teach pendant; an engineering reference.
Creator: Auledas
License: CC BY-SA 4.0
Display changes: Wikimedia 960-pixel thumbnail converted to WebP; scientific content unchanged.

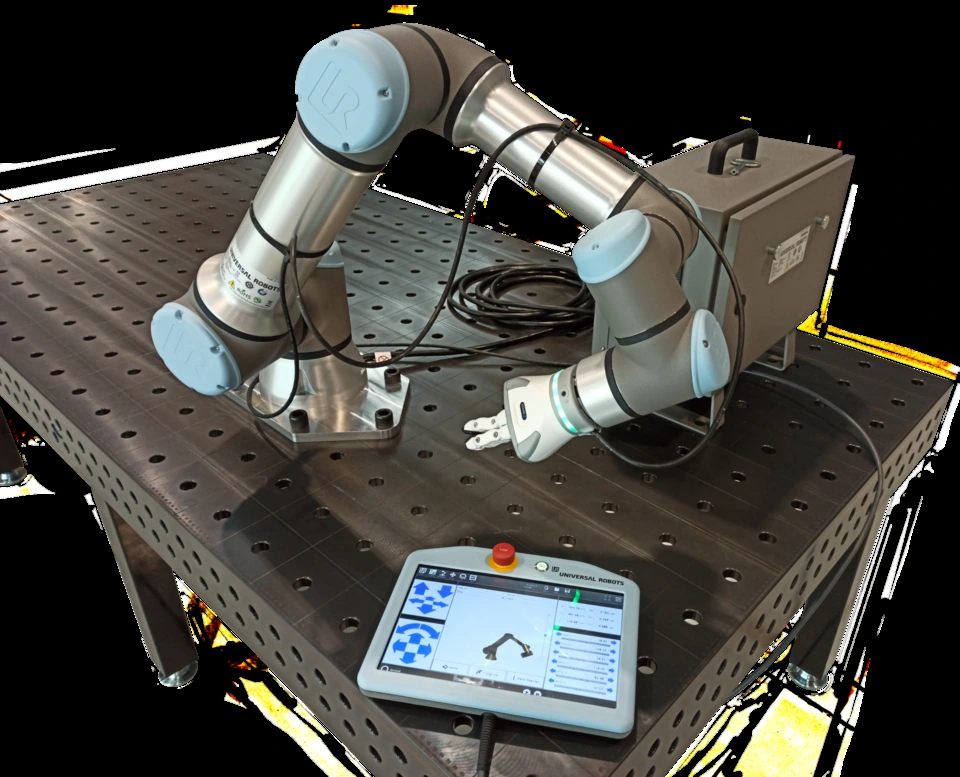
Wind-tunnel inlet flow visualization
NASA flow-visualization study of a Vought inlet on a wind-tunnel test stand.
Creator: Donald Huebler
License: Public domain
Display changes: Wikimedia 960-pixel thumbnail converted to WebP; scientific content unchanged.

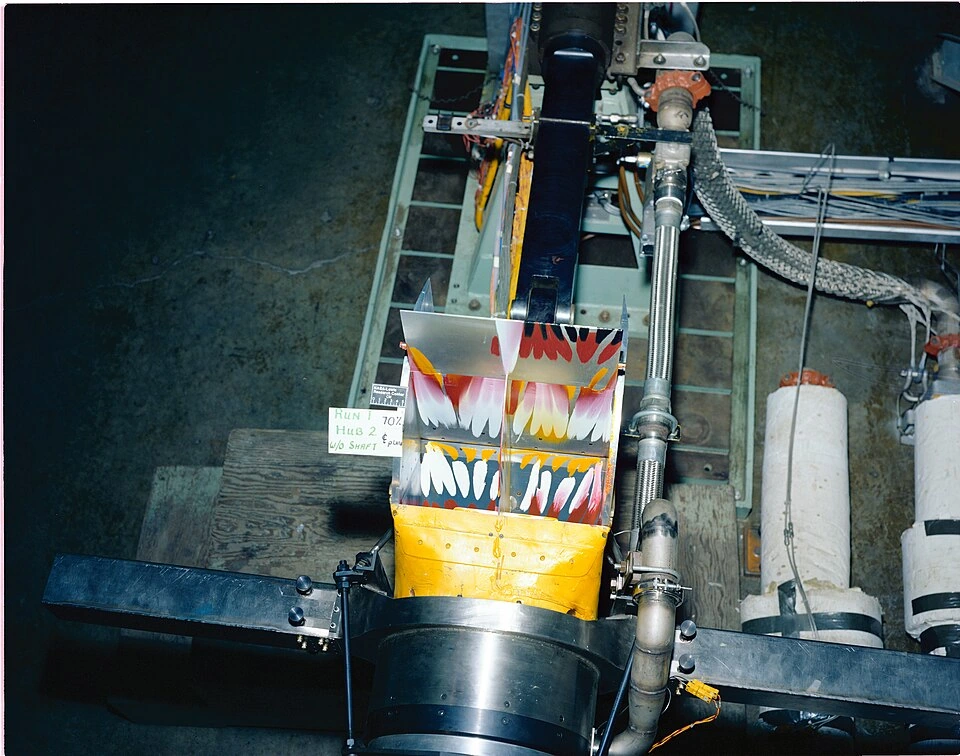
Coronal T2-weighted brain MRI
A coronal T2-weighted MRI image of the human brain.
Creator: 511KeV
License: CC BY-SA 4.0
Display changes: Wikimedia 960-pixel thumbnail converted to WebP; scientific content unchanged.

Real ECG recording
The ECG figure uses record 208, lead MLII, from the MIT-BIH Arrhythmia Database, accessed through SciPy’s sample dataset. The displayed interval is 9–12 seconds within SciPy’s excerpt, sampled at 360 Hz.
Data creators: George B. Moody and Roger G. Mark.
Data license: Open Data Commons Attribution License v1.0. Figure calculated for this website.
Moody GB, Mark RG. The impact of the MIT-BIH Arrhythmia Database. IEEE Engineering in Medicine and Biology, 2001;20(3):45–50.
PhysioNet reference: Pollard T et al. PhysioNet as a global platform for biomedical research. Nature Health, 2026.
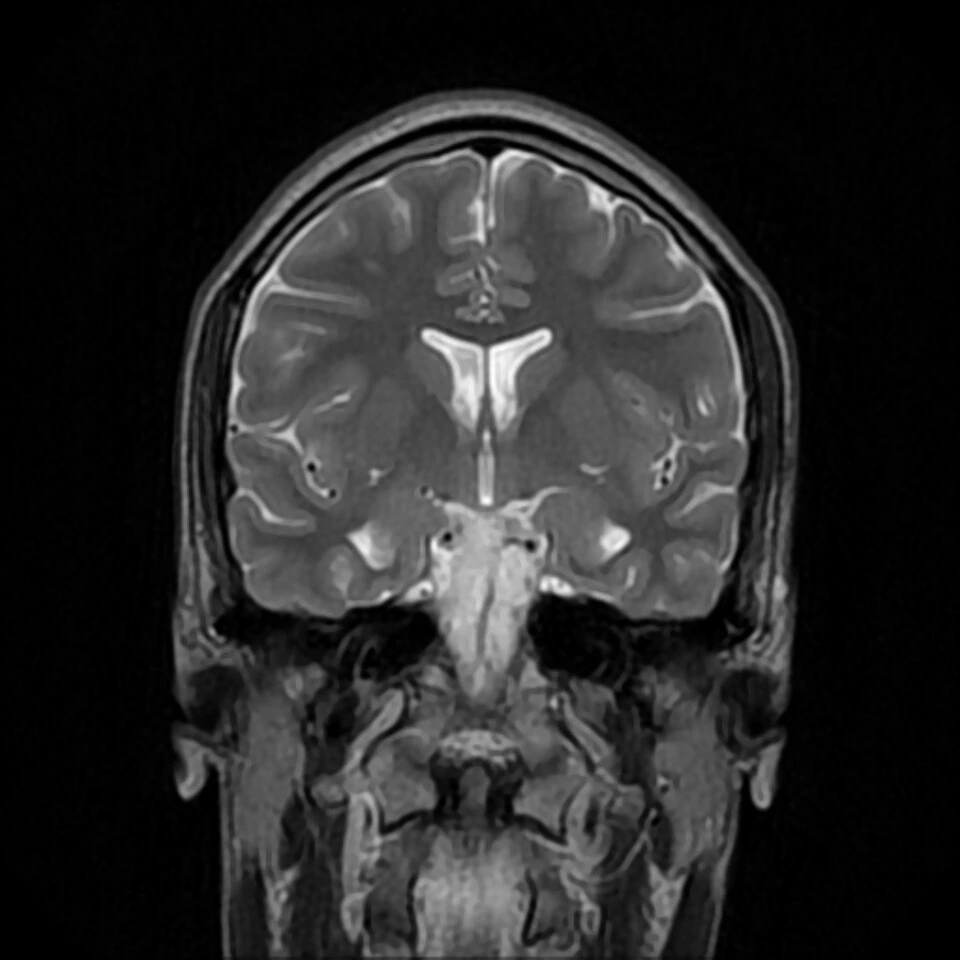
Engineering signal analysis
x(t)=0.7 sin(2π5t)+0.3 sin(2π12t); 200 samples at 100 Hz; positive interior DFT coefficients scaled by 2/N.
Created for Quoneon as an educational mathematical figure. Open the figure
Paired measurement agreement
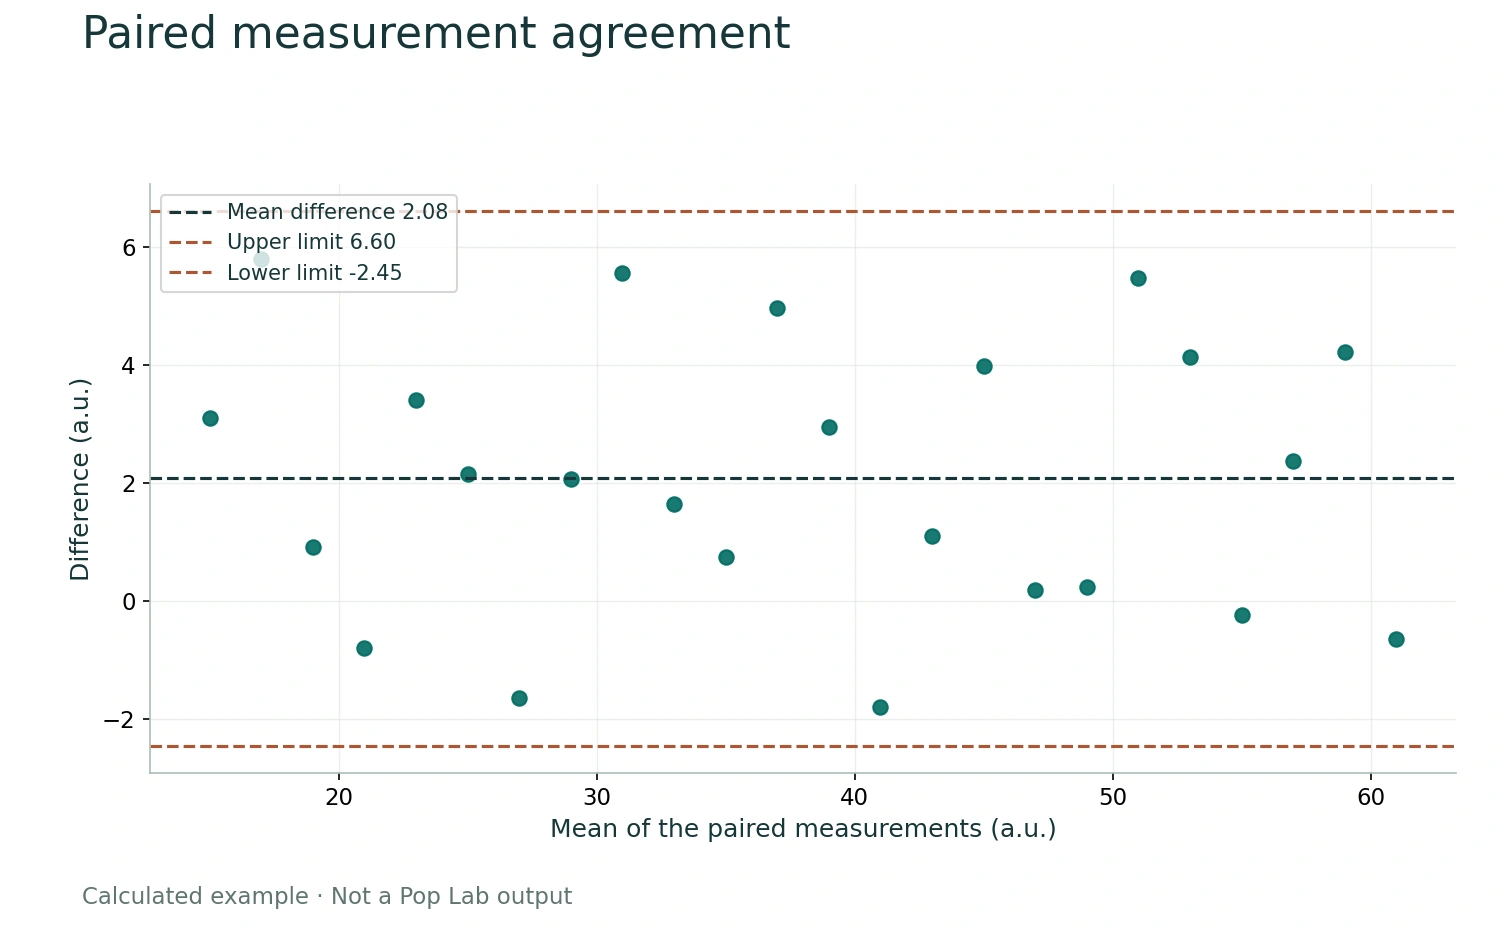
Means are 15+2i and differences are 2+3sin(1.8i)+1.1cos(0.67i), i=0…23. Limits are mean difference ±1.96 sample SD. No experimental data.
Created for Quoneon as an educational mathematical figure. Open the figure
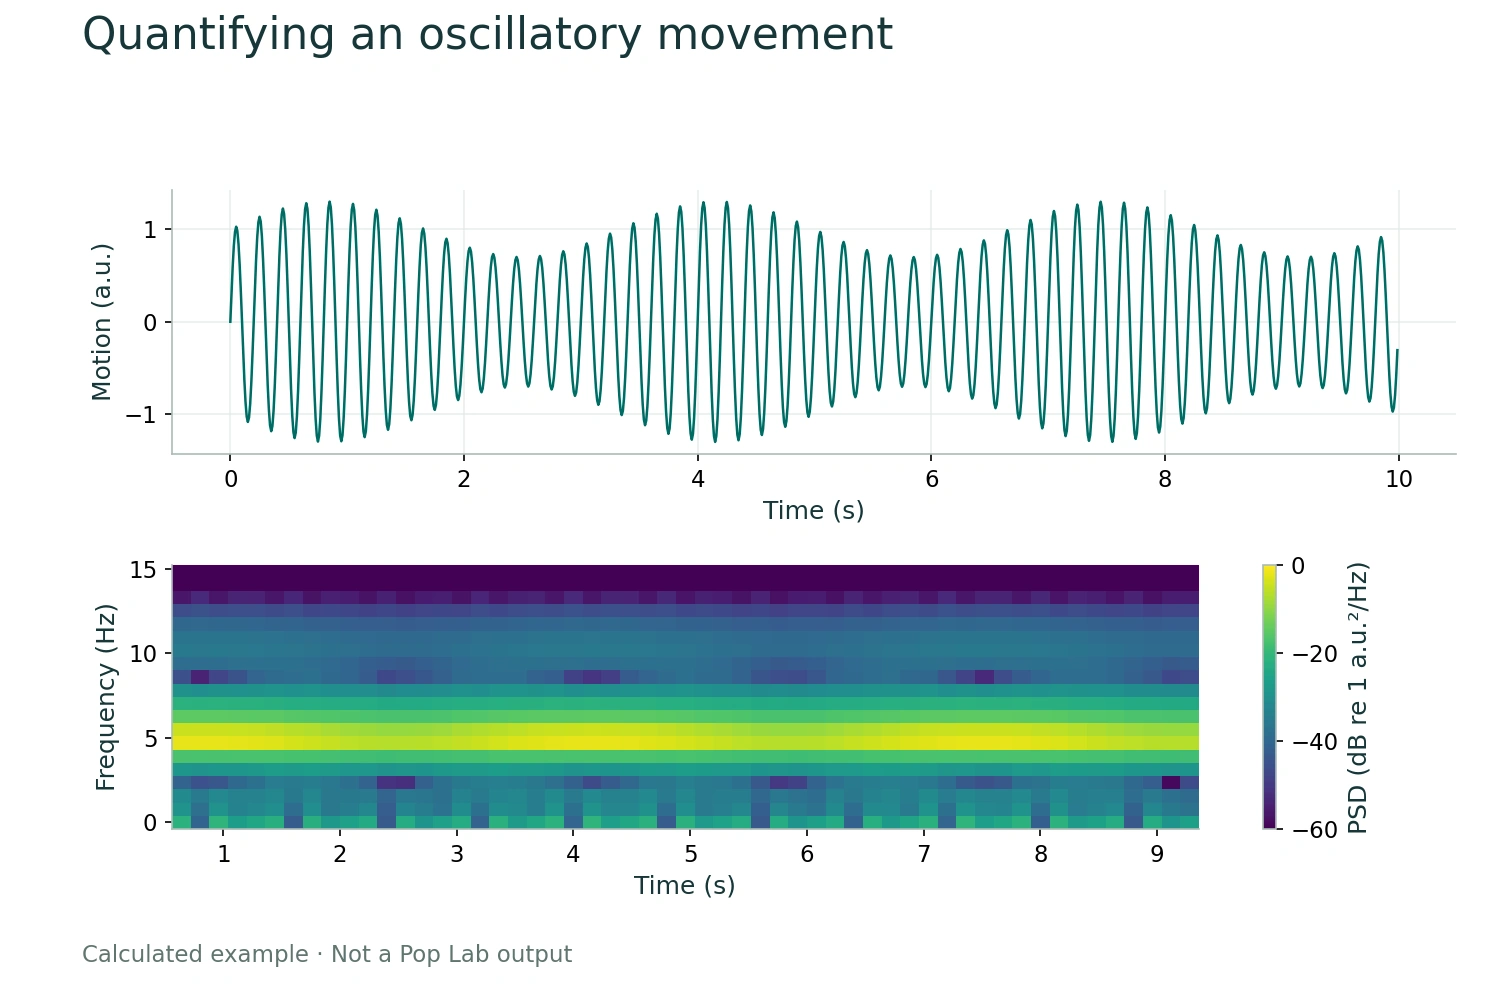
Quantifying an oscillatory movement
1000 samples at 100 Hz; x(t)=[1+0.3sin(2π0.3t)]sin(2π5t). Spectrogram uses 128-sample segments and 112-sample overlap. This is not a Parkinson’s recording or a diagnostic example.
Created for Quoneon as an educational mathematical figure. Open the figure
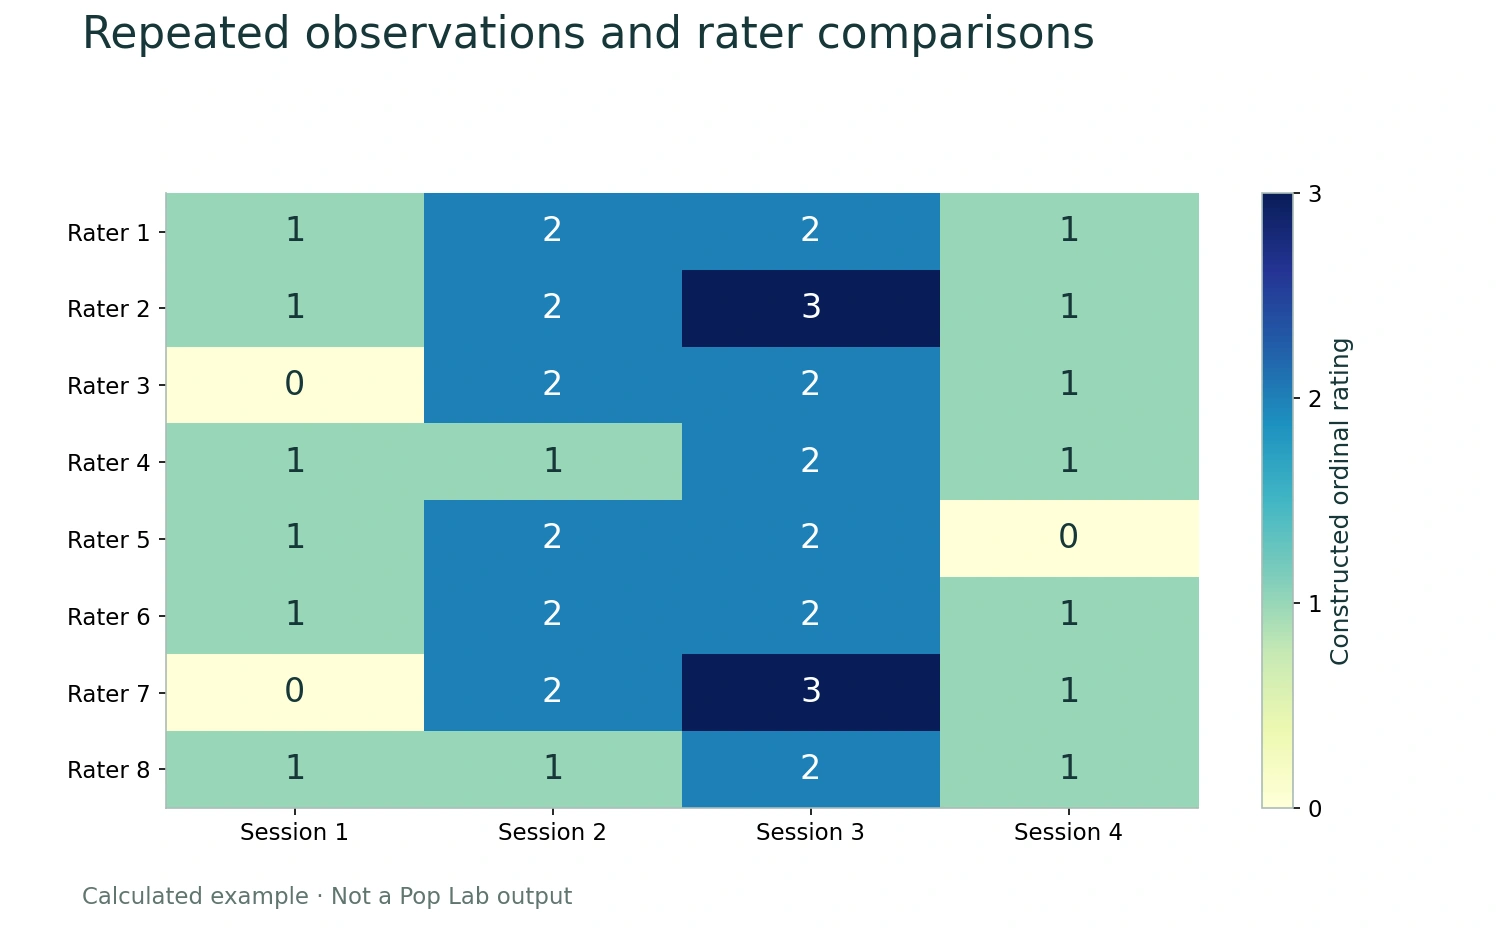
Repeated observations and rater comparisons
Eight hypothetical raters and four hypothetical sessions; integer values from 0 to 3. No participant data, named scale, agreement estimate, or clinical outcome is implied.
Created for Quoneon as an educational mathematical figure. Open the figure
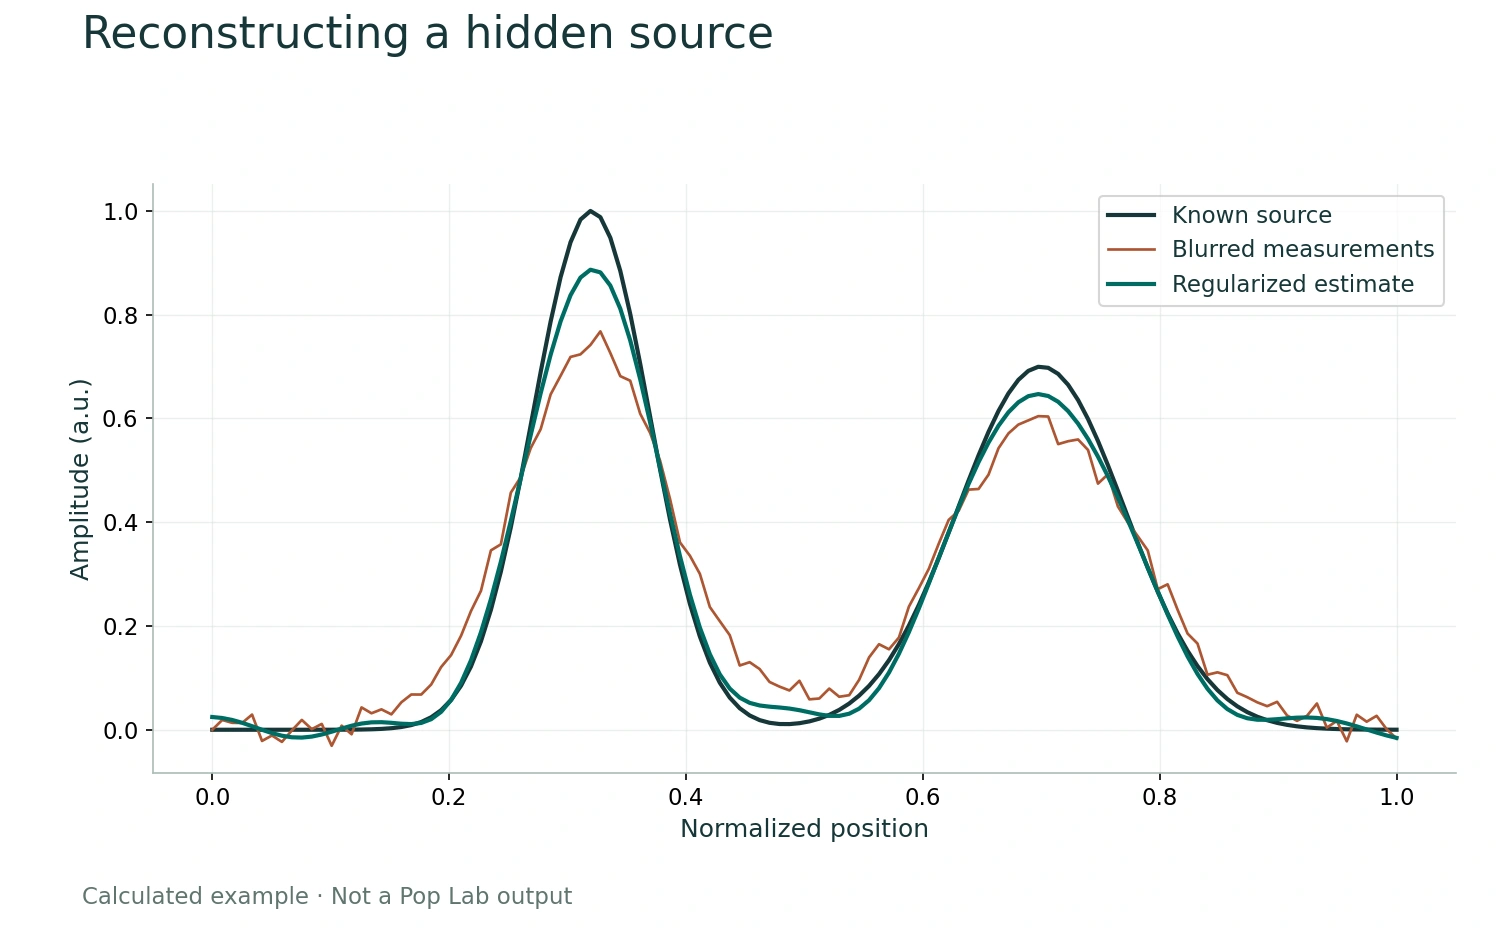
Reconstructing a hidden source
A is a row-normalized Gaussian blur matrix, σ=0.045; noise SD 0.018, RNG seed 12. Estimate solves (AᵀA+0.045I)x=Aᵀy. This is an illustrative inverse problem, not a brain reconstruction.
Created for Quoneon as an educational mathematical figure. Open the figure
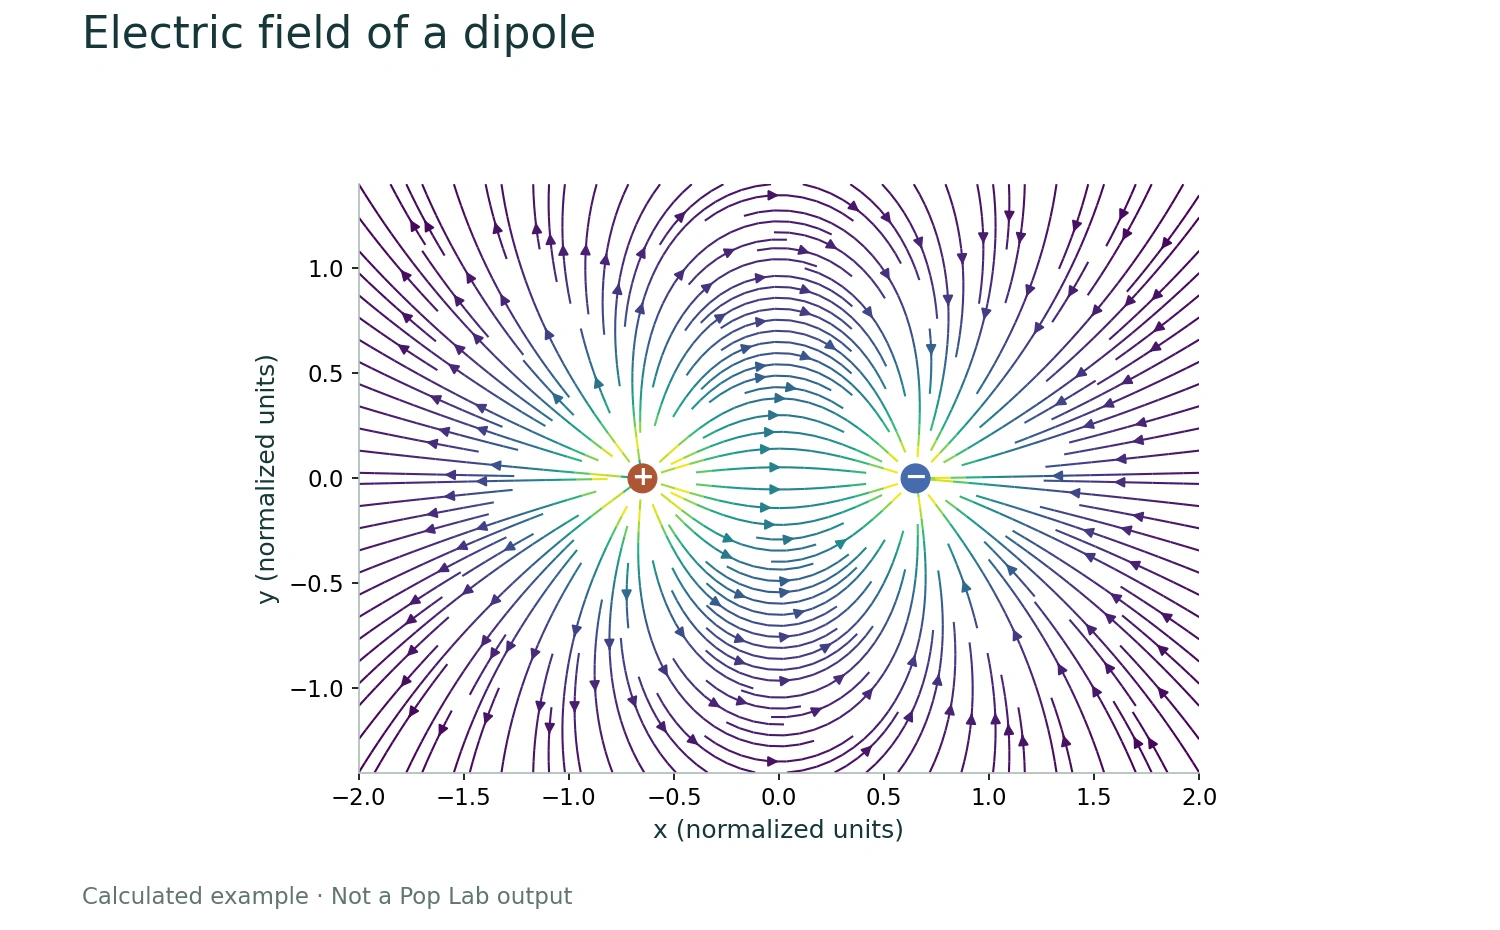
Electric field of a dipole
E(x,y)=Σq(r−rq)/|r−rq|³, with q=+1 at x=−0.65 and q=−1 at x=+0.65. The near-charge denominator is clipped for drawing stability; normalized units.
Created for Quoneon as an educational mathematical figure. Open the figure
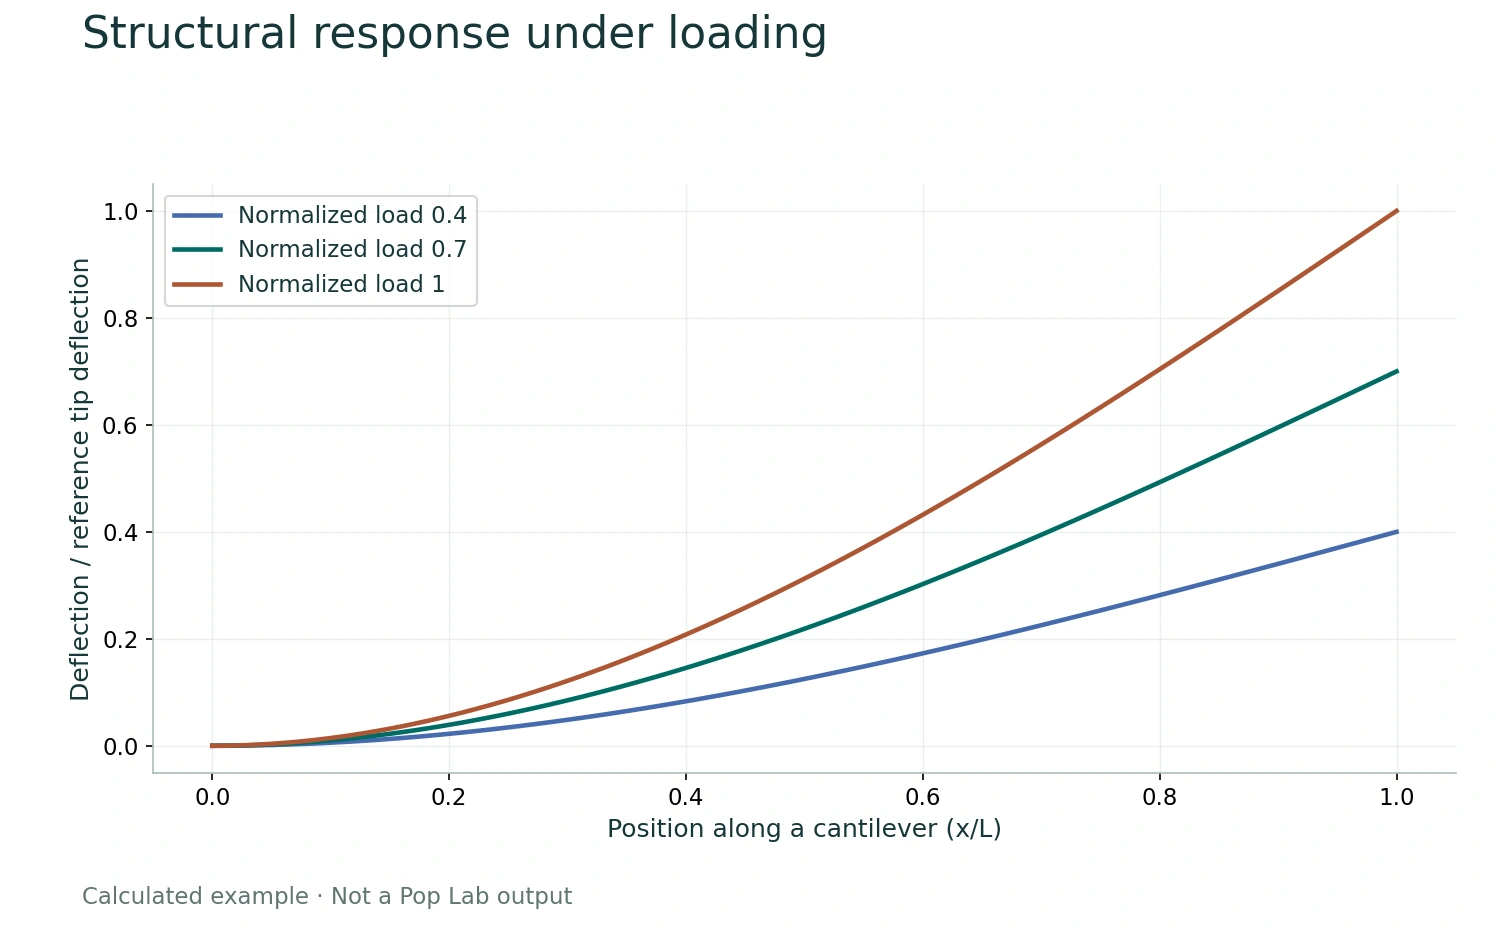
Structural response under loading
Euler–Bernoulli small-deflection solution w(x)=Px²(3L−x)/(6EI), normalized by the tip deflection of the reference load. Curves use relative loads 0.4, 0.7, 1. This is analytic, not an FEA solver output.
Created for Quoneon as an educational mathematical figure. Open the figure
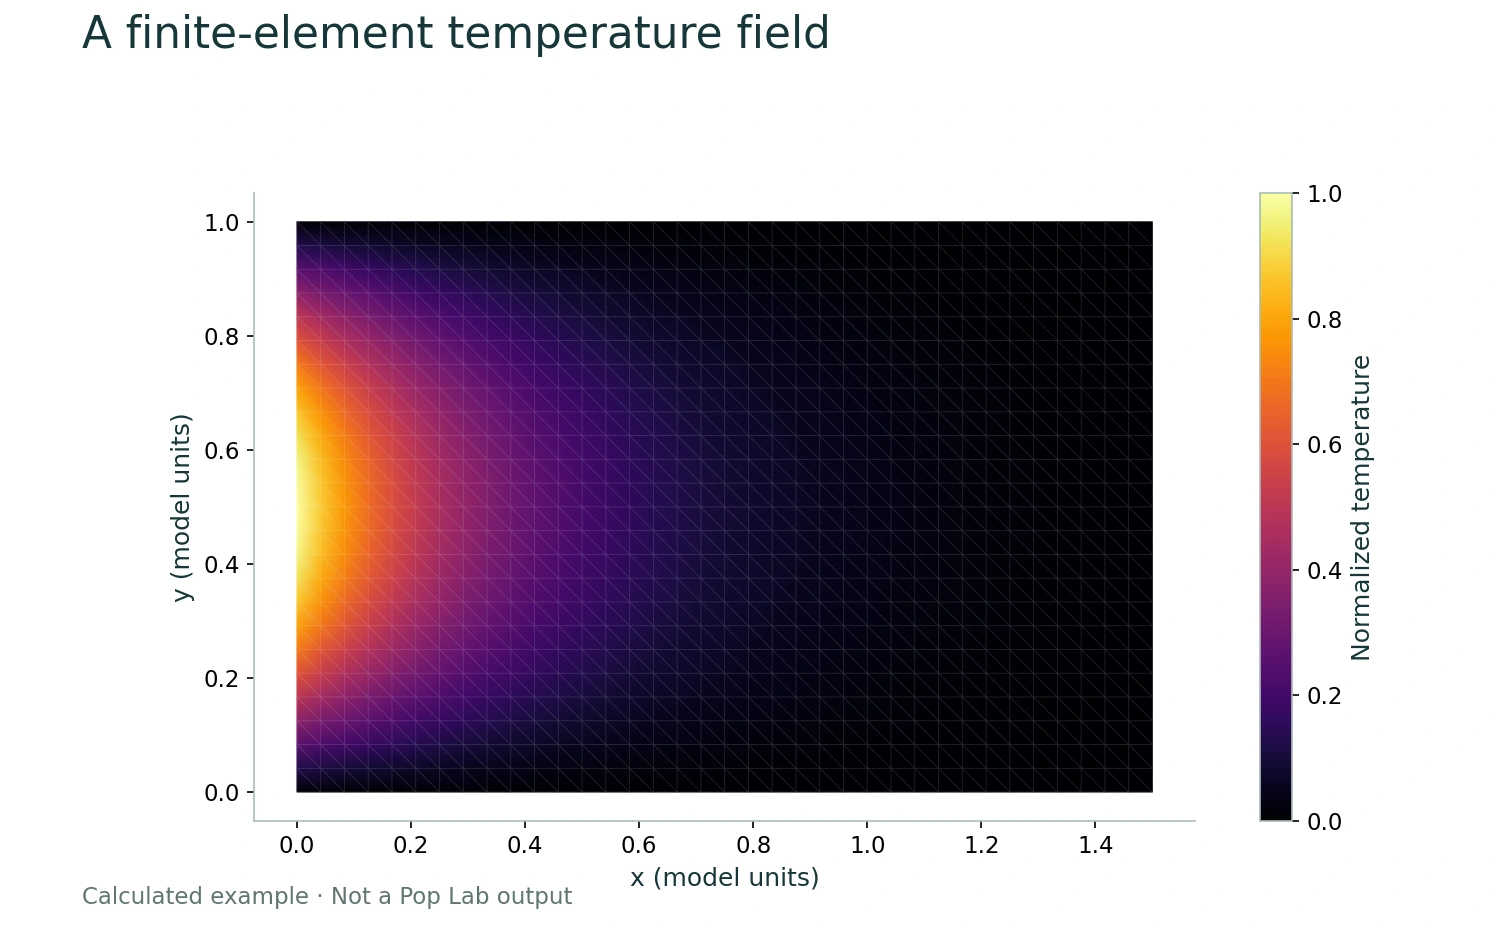
A finite-element temperature field
Linear triangular FEM solves ∇²T=0 on [0,1.5]×[0,1], with T(0,y)=sin(πy) and zero temperature on the other three edges. 925 nodes, 1728 triangles. Maximum nodal error against the analytic solution is below 0.002. Educational calculation, not a Pop Lab output.
Created for Quoneon as an educational mathematical figure. Open the figure
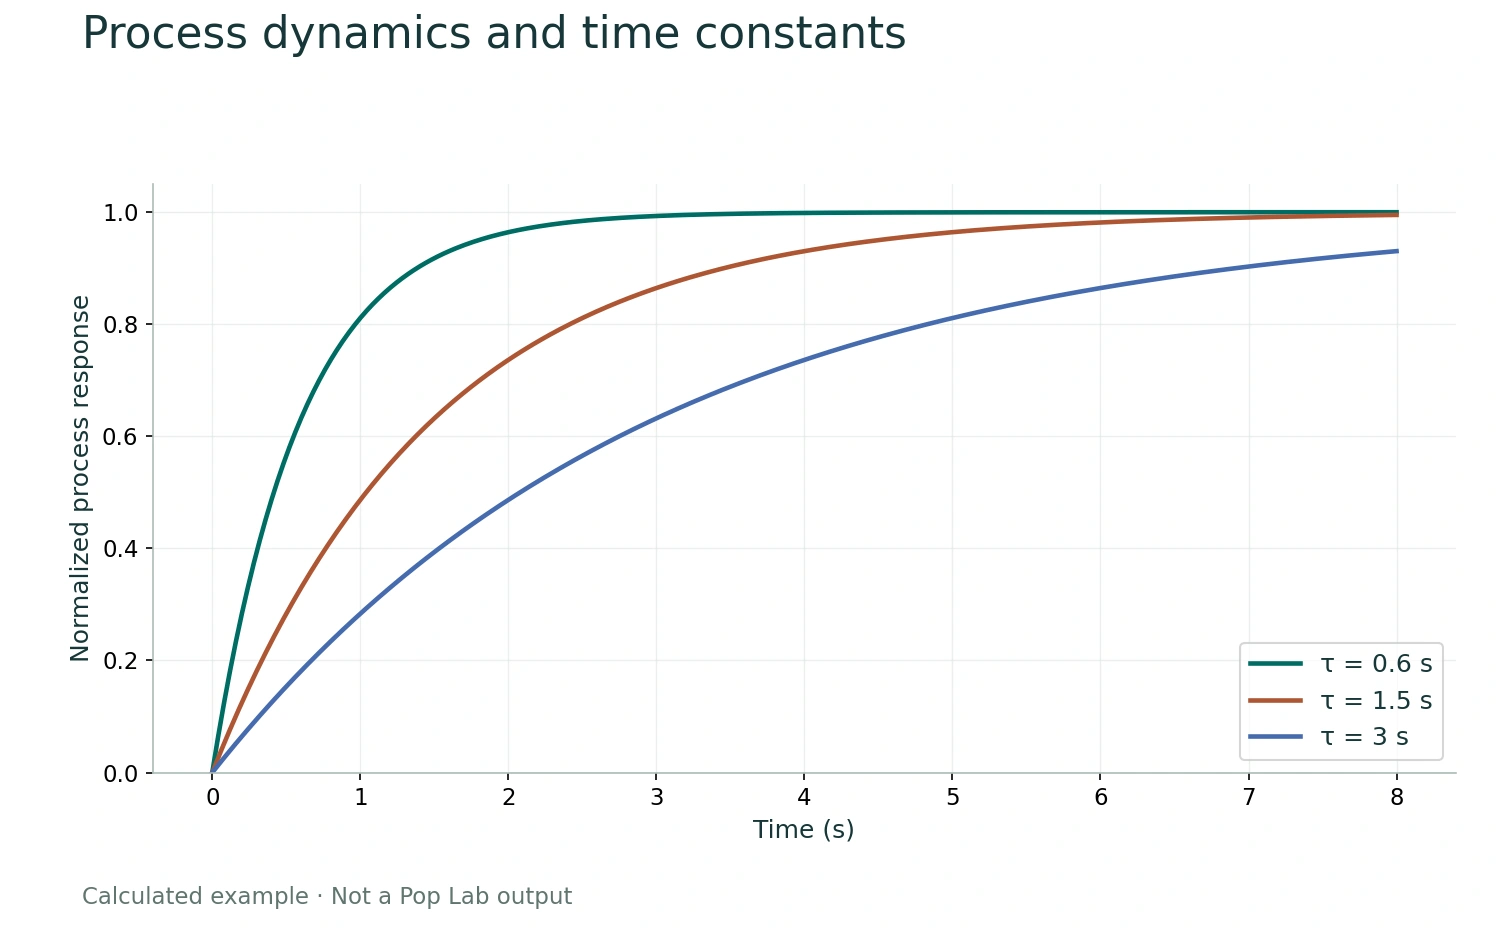
Process dynamics and time constants
y(t)=1−exp(−t/τ) with y(0)=0 and τ=0.6, 1.5, 3 seconds. Synthetic analytical example.
Created for Quoneon as an educational mathematical figure. Open the figure
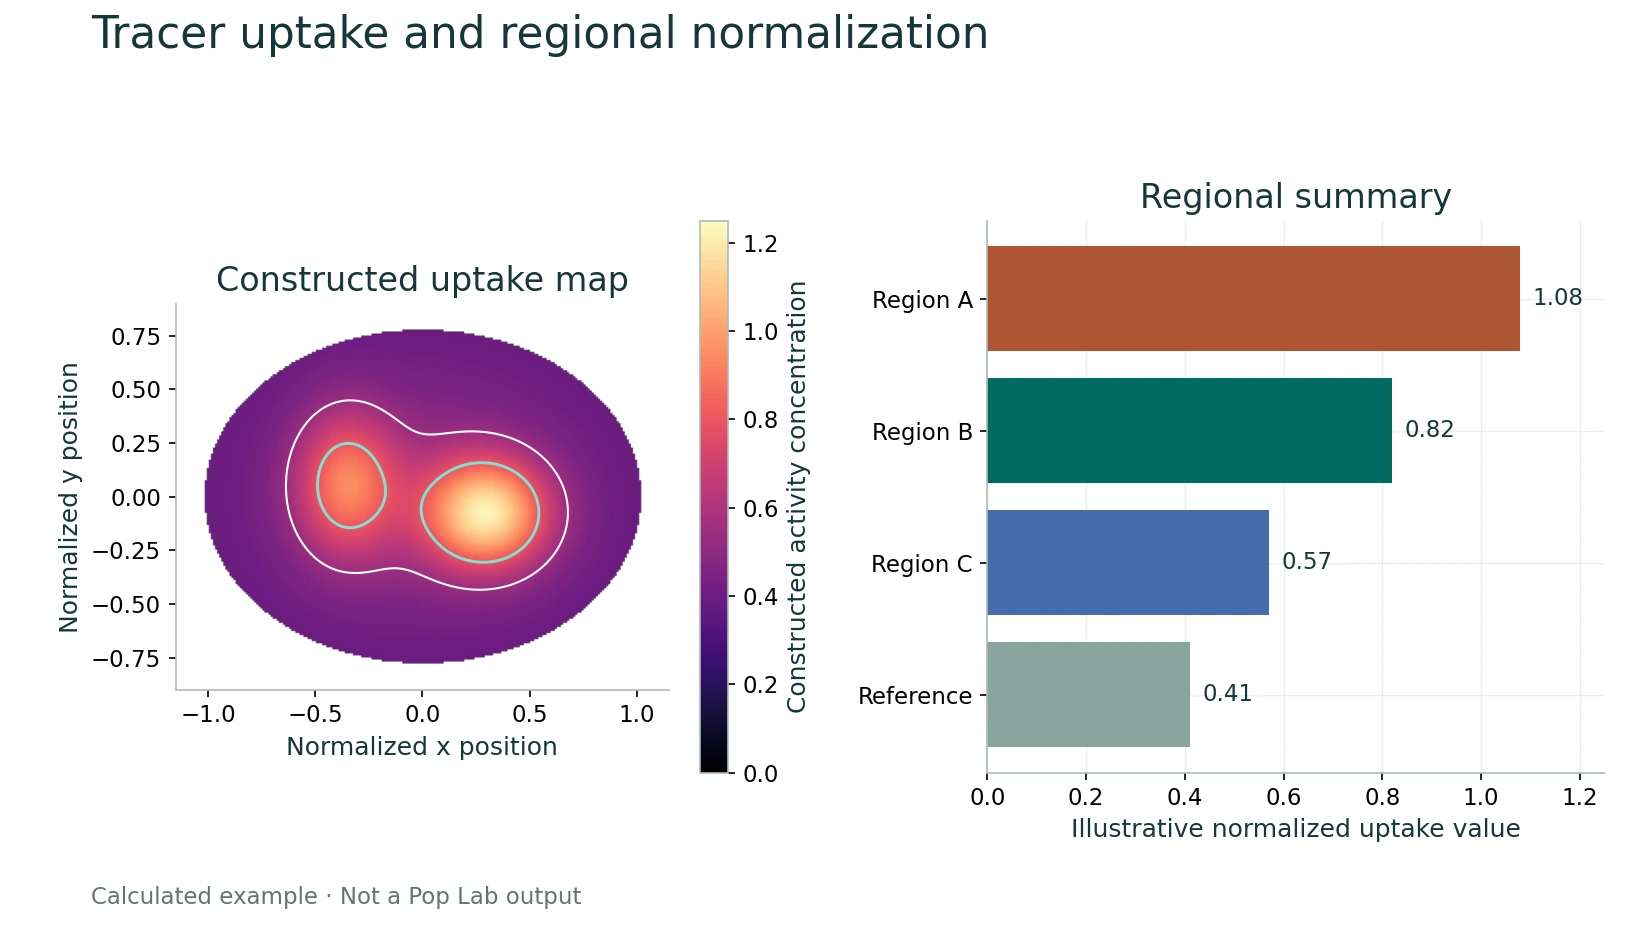
Tracer uptake and regional normalization
The image is an analytic elliptical mask combining three Gaussian fields. Regional values [1.08, 0.82, 0.57, 0.41] are defined teaching values. No patient, scanner, administered-activity, or clinical data are used.
Created for Quoneon as an educational mathematical figure. Open the figure
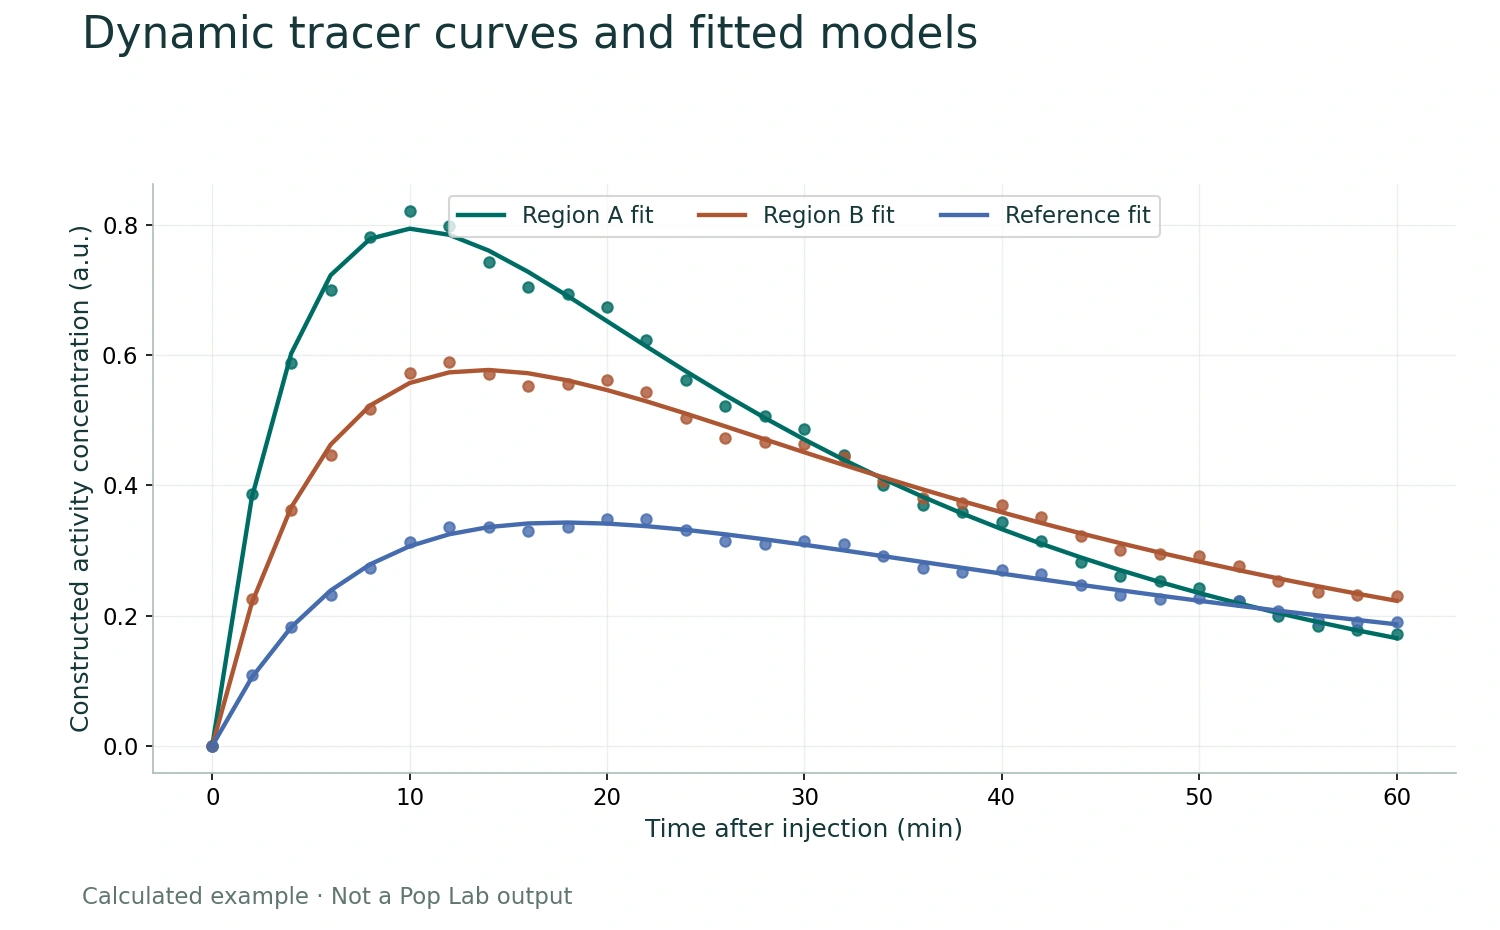
Dynamic tracer curves and fitted models
For each region, C(t)=A[1−exp(−k_in t)]exp(−k_out t); displayed samples add a deterministic 3.5% sinusoidal deviation. This is a teaching example with no patient or scanner data.
Created for Quoneon as an educational mathematical figure. Open the figure
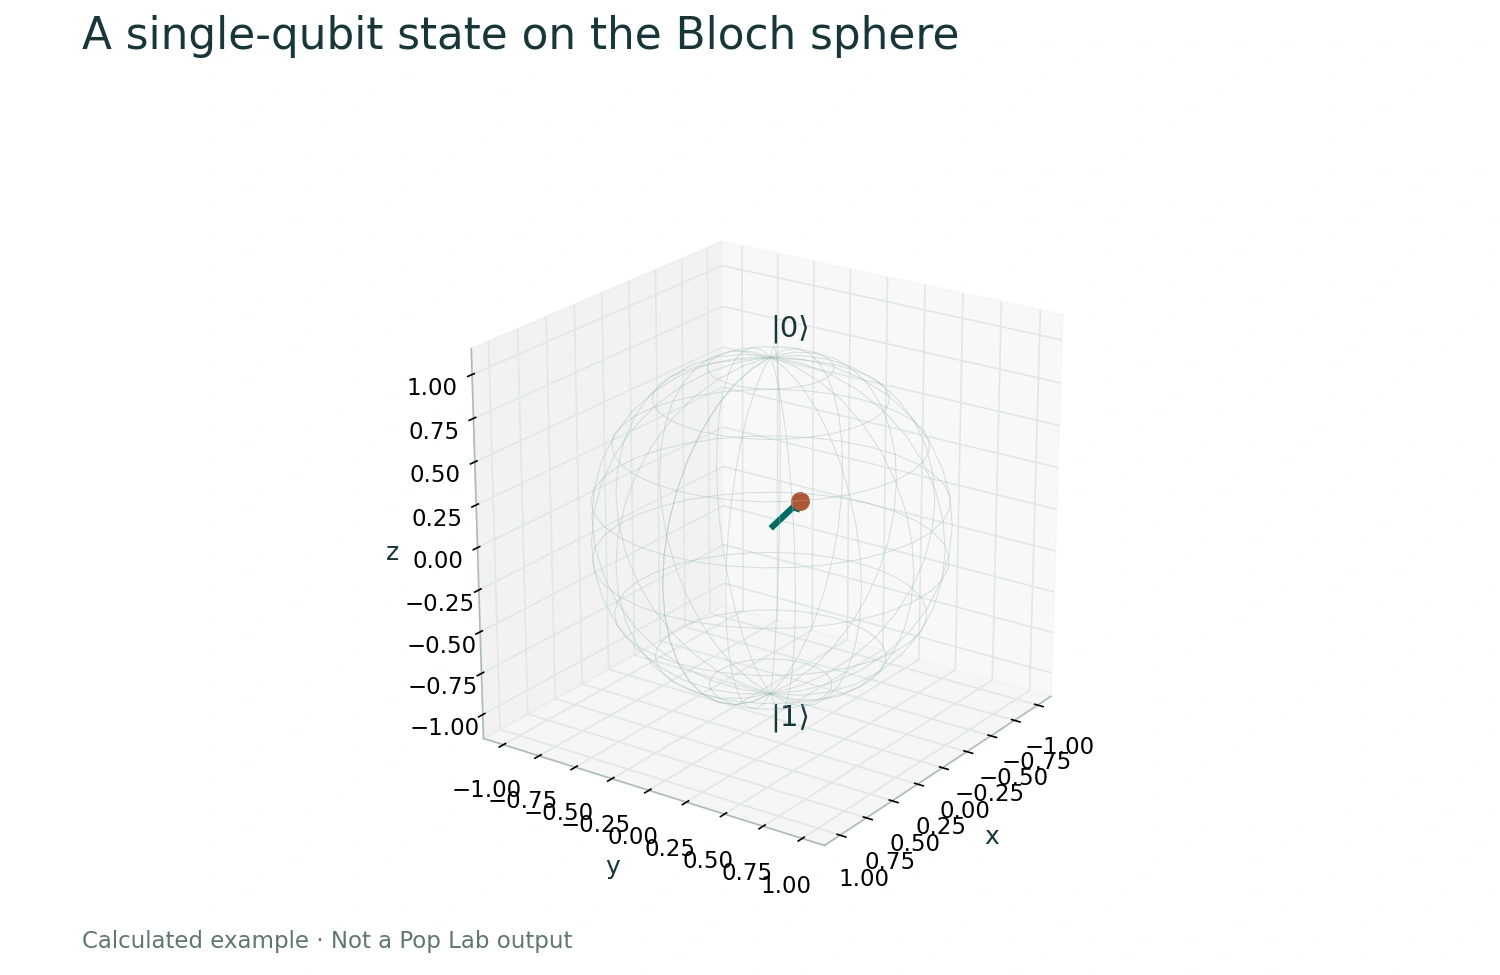
A single-qubit state on the Bloch sphere
θ=π/3 and φ=π/4; r=(sinθcosφ,sinθsinφ,cosθ). |ψ⟩=cos(θ/2)|0⟩+exp(iφ)sin(θ/2)|1⟩. Mathematical example, not quantum hardware data.
Created for Quoneon as an educational mathematical figure. Open the figure
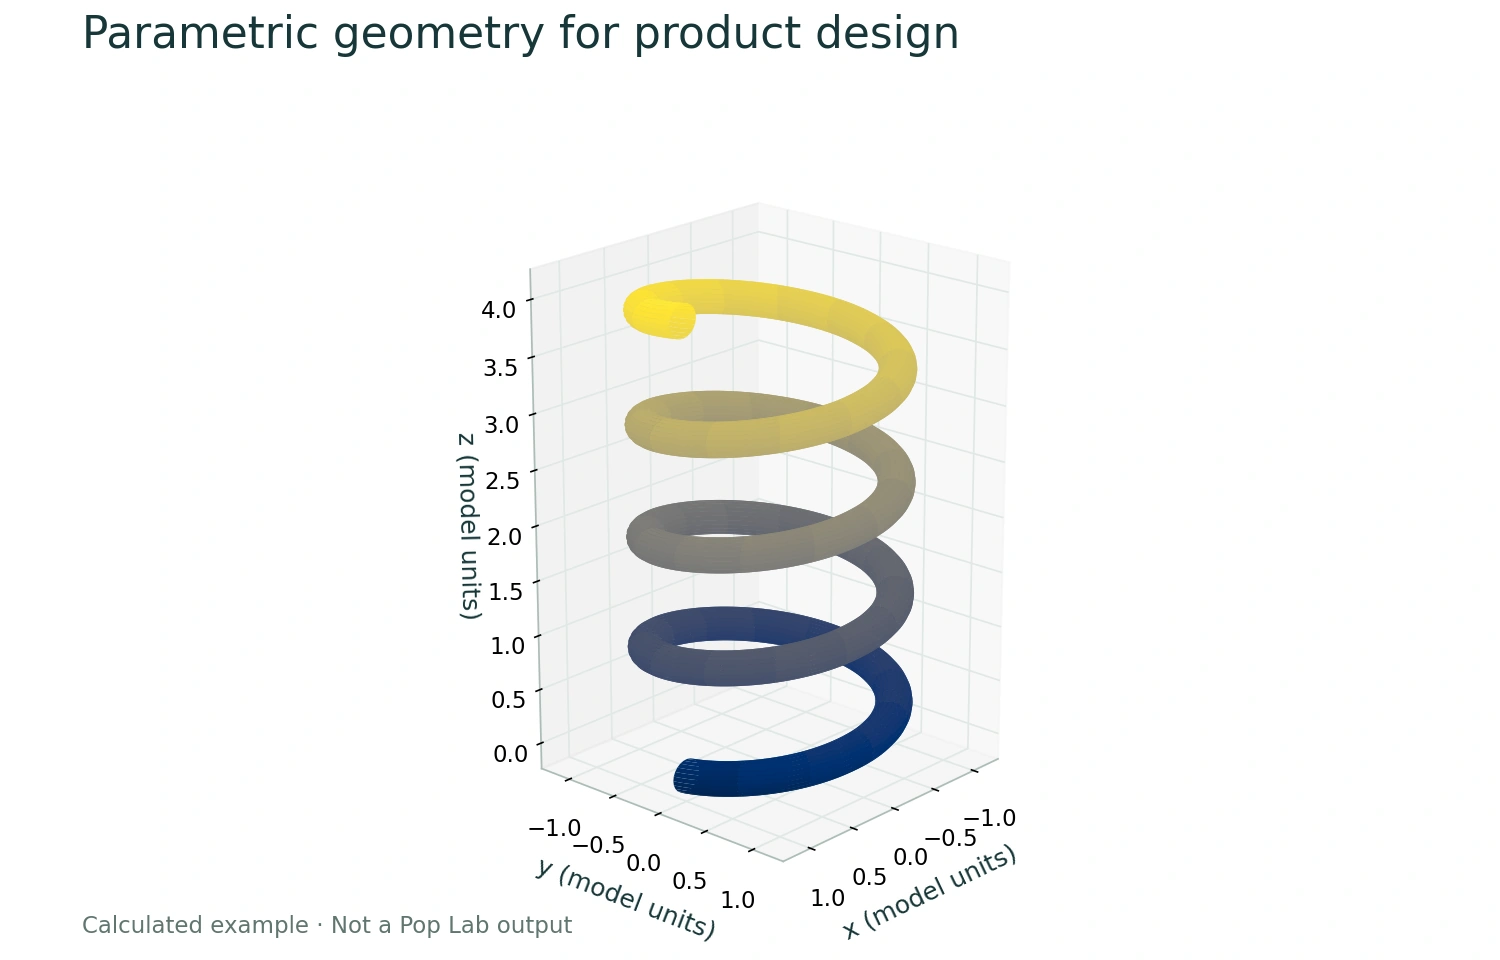
Parametric geometry for product design
Centerline radius 1; tube radius 0.15; four turns; axial rise 0.16 per radian. Mathematical surface, not a manufactured component or CAD software screenshot.
Created for Quoneon as an educational mathematical figure. Open the figure
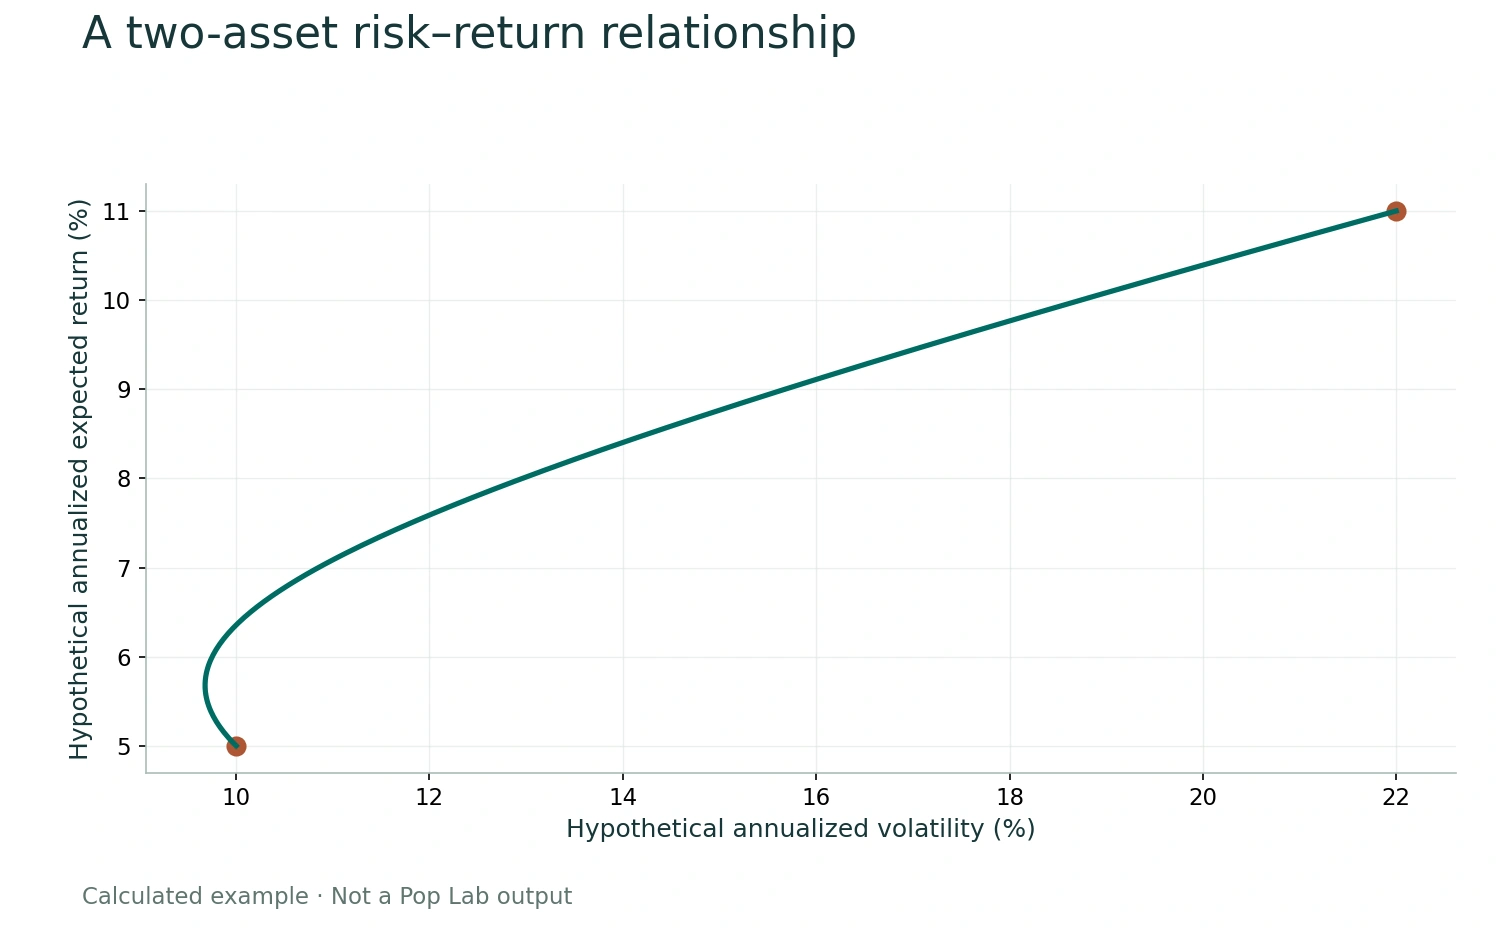
A two-asset risk–return relationship
Hypothetical means 5%,11%; standard deviations 10%,22%; correlation 0.2. Weights range from 0 to 1. This is a mathematical illustration, not market data or a recommendation.
Created for Quoneon as an educational mathematical figure. Open the figure
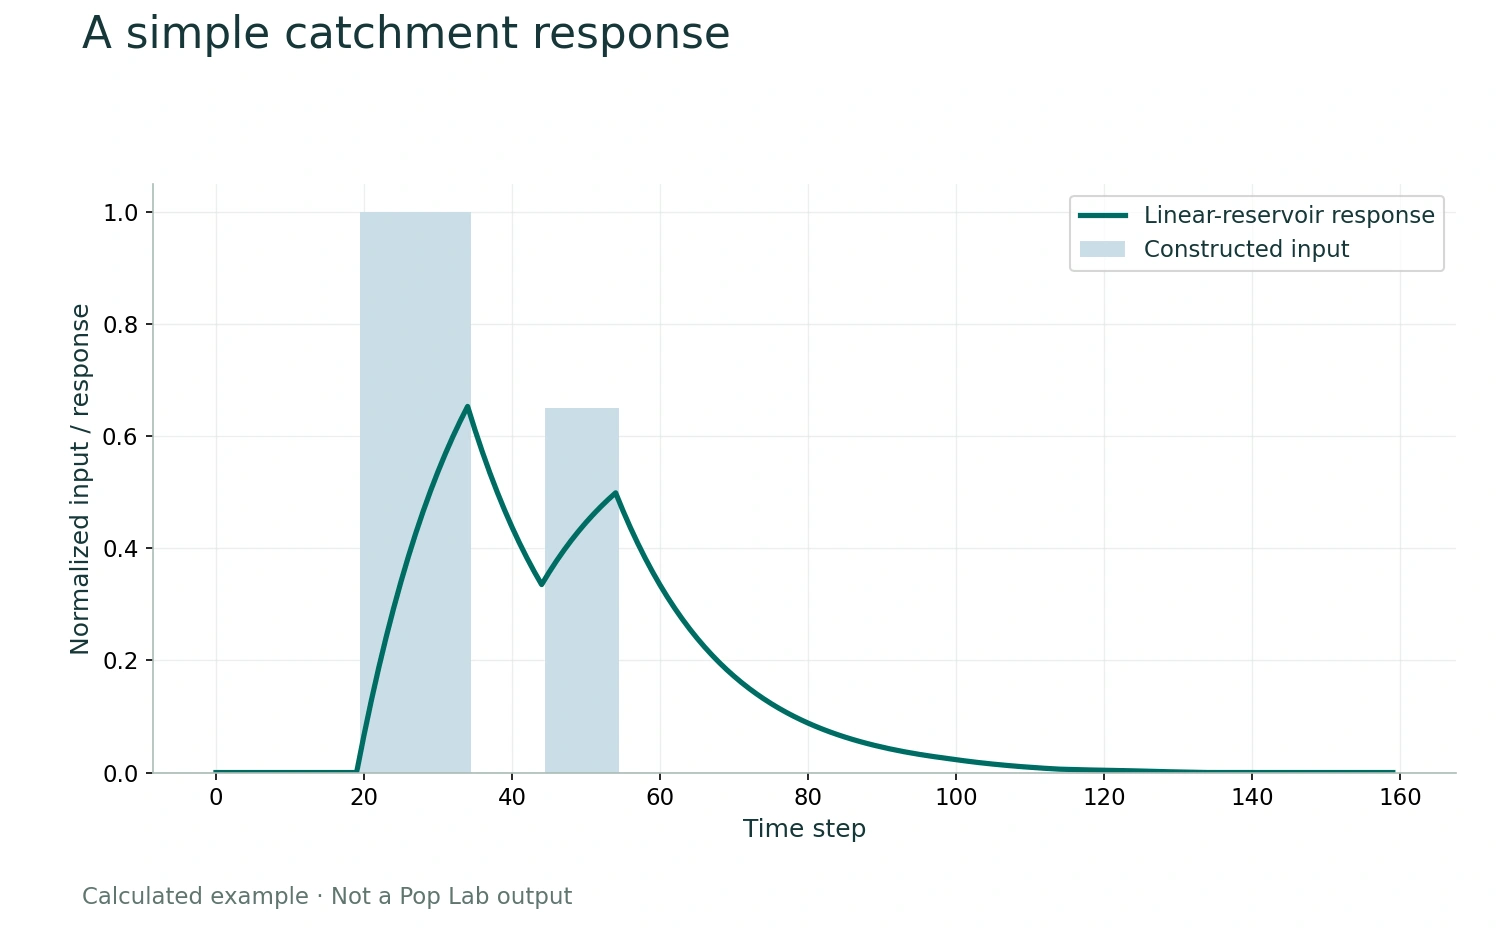
A simple catchment response
Two rectangular input pulses are convolved with exp(−k/15)/15 over 80 steps. Values are normalized; no observed weather, geography, or forecast is represented.
Created for Quoneon as an educational mathematical figure. Open the figure
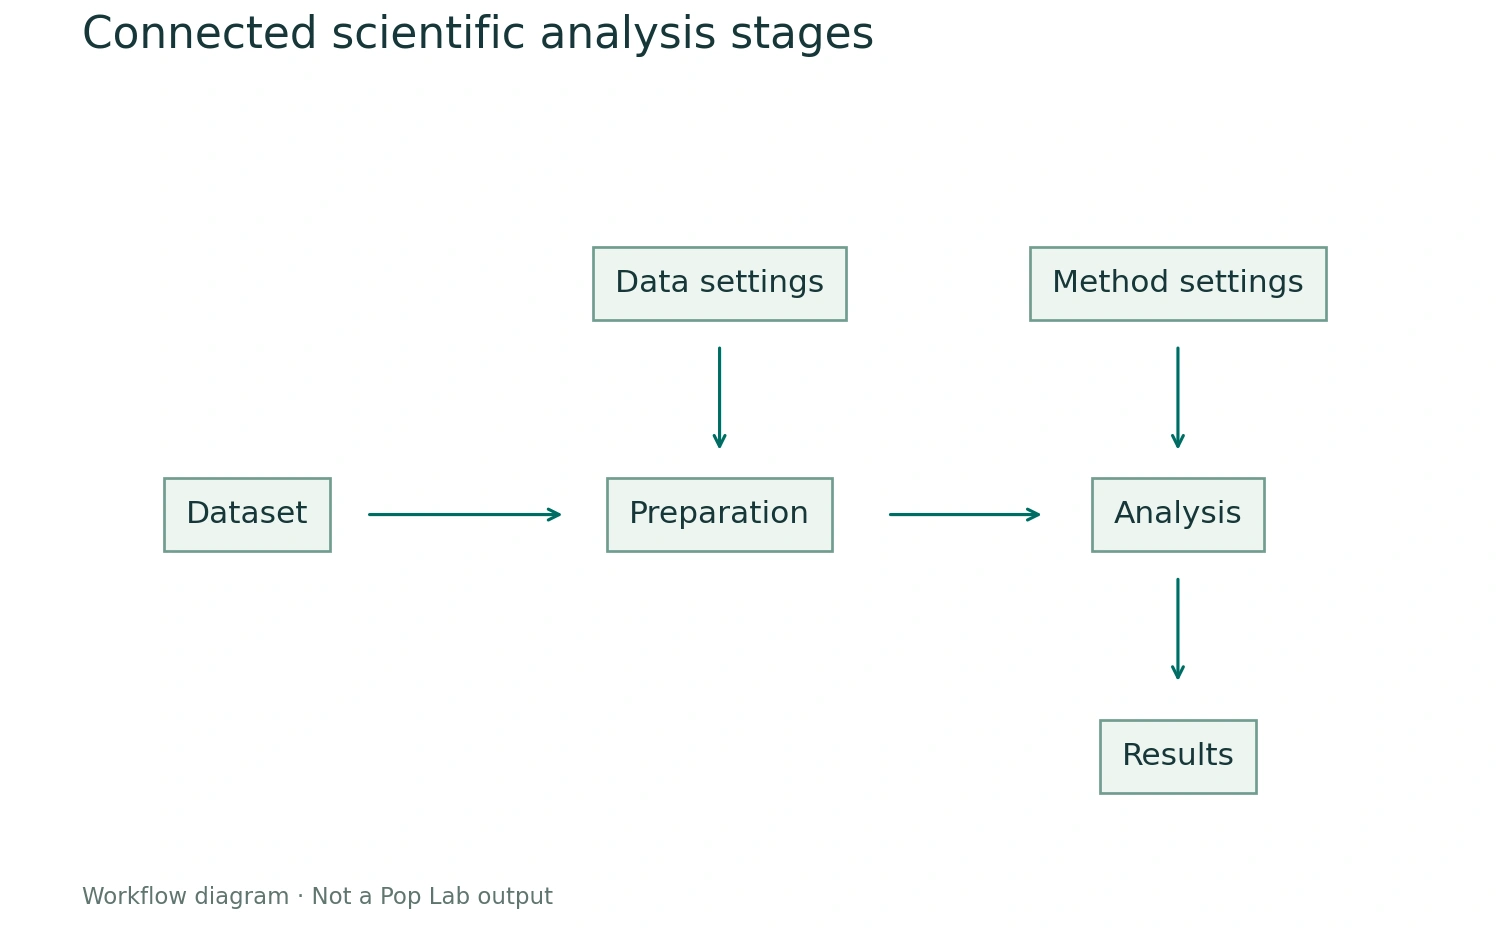
Connected scientific analysis stages
Functional diagram only. It describes a generic workflow and is not a screenshot or a claim about available application blocks.
Created for Quoneon as an educational mathematical figure. Open the figure
Editorial artwork
The earlier abstract editorial images were generated for Quoneon. Scientific pages now use the subject-specific reference images and calculated figures documented here.